Highlight negative values in a chart in PowerPoint 2007 for Windows. This result can be achieved by using the Invert if Negative option.
Author: Geetesh Bajaj
Product/Version: PowerPoint 2007 for Windows
OS: Microsoft Windows XP and higher
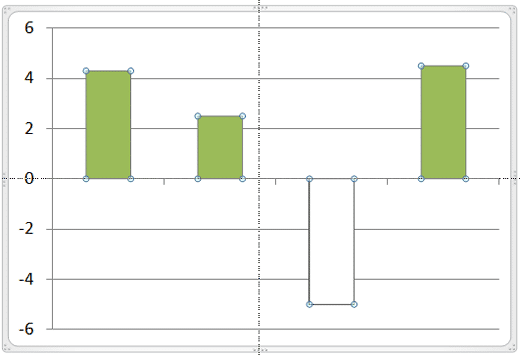
If your chart has negative values, then PowerPoint uses the same fill color for negative values as you can see in the sample chart within Figure 1, below. Fortunately, you can override this color choice with a convenient Invert if Negative option that we briefly explored towards the end of the Changing Fills and Outlines of Charts tutorial.
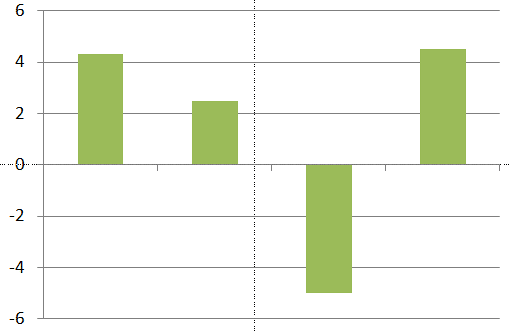
Figure 1: Chart with negative values
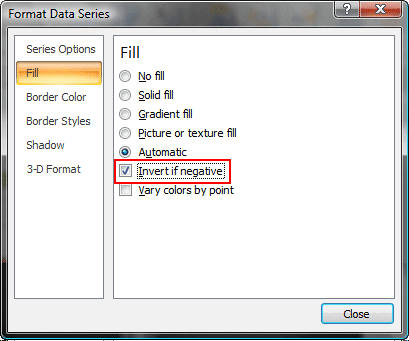
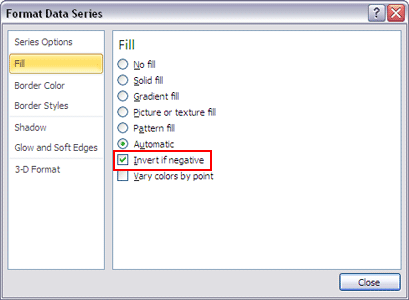
The Invert if Negative option is only enabled for column, bar, cylinder, cone, and pyramid chart types. The pie and area chart types do not have this option as they don't plot negative figures.
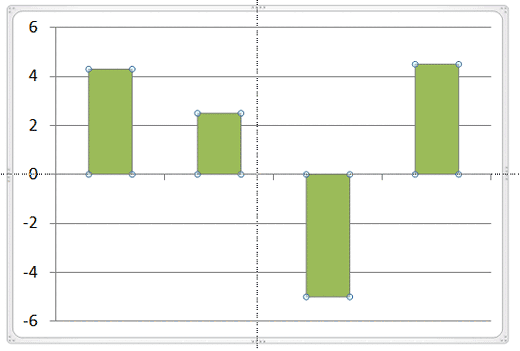
To use the Invert if Negative option you must have a chart that has negative values, as shown in Figure 1, above. Then, follow these steps to use the Invert if Negative option in PowerPoint 2007 for Windows:


See Also:
Advanced Chart Techniques: Using the Invert if Negative Option for Charts (Glossary Page)
Using the Invert if Negative Option for Charts in PowerPoint 2013 for Windows
Using the Invert if Negative Option for Charts in PowerPoint 2011 for Mac
Using the Invert if Negative Option for Charts in PowerPoint 2003 and 2002 for Windows
You May Also Like: Key Steps for Feedback When Someone Has Done a Dreadful Job | Dates PowerPoint Templates


Microsoft and the Office logo are trademarks or registered trademarks of Microsoft Corporation in the United States and/or other countries.