Highlight negative values in a chart in PowerPoint 2011 for Mac. This result can be achieved by using the Invert if Negative option.
Author: Geetesh Bajaj
Product/Version: PowerPoint 2011 for Mac
OS: Mac OS X
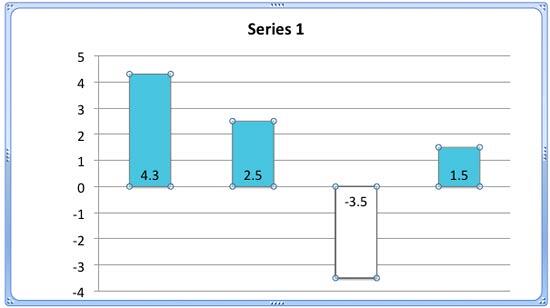
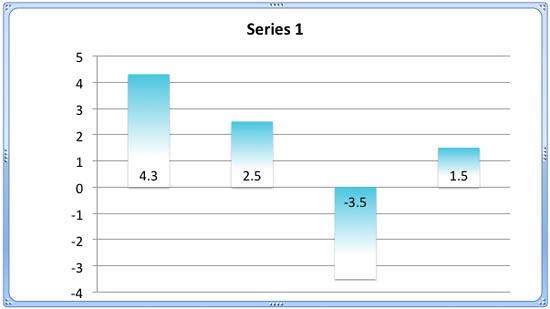
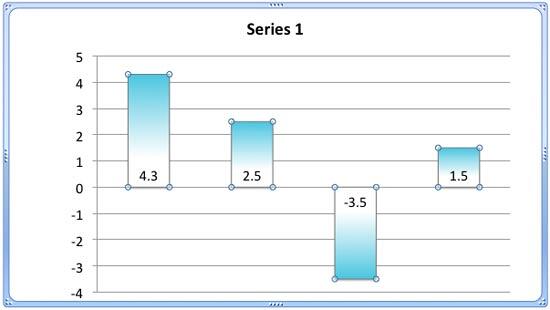
Does your chart has any data with negative values? PowerPoint by default uses the same fill color for negative values as is used for positive values. Look at Figure 1, below where we have used solid fills for our columns representing a series. Of course, you can override this nature of PowerPoint using the Invert if Negative option, that we last explored at the end of our Changing Fills and Outlines of Charts tutorial. In this tutorial, let us explore this option further.
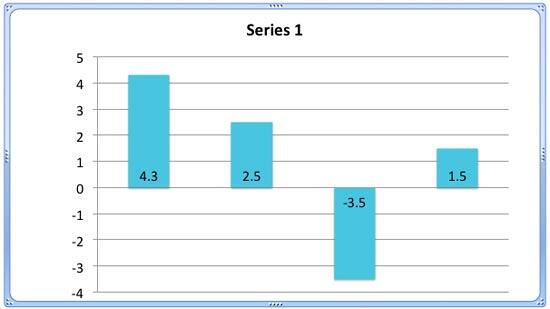
Figure 1: Chart with negative values
The Invert if Negative option is only available for column, bar, cylinder, cone, and pyramid chart types. The pie and area chart types do not have this option as they don't plot negative figures.
To use the Invert if Negative option you must have inserted a chart on your slide that has negative values, as shown in Figure 1, above.
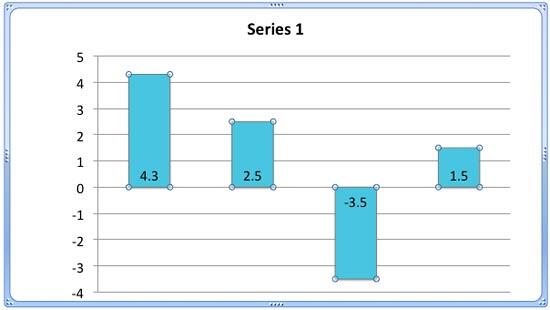
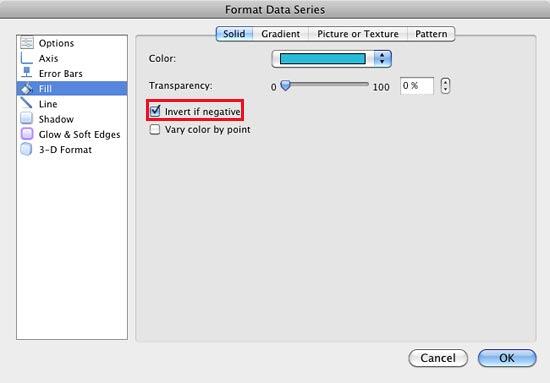
Follow these steps to use the Invert if Negative option in PowerPoint 2011 for Mac:

See Also:
Advanced Chart Techniques: Using the Invert if Negative Option for Charts (Glossary Page)
Using the Invert if Negative Option for Charts in PowerPoint 2013 for Windows
Using the Invert if Negative Option for Charts in PowerPoint 2007 for Windows
Using the Invert if Negative Option for Charts in PowerPoint 2003 and 2002 for Windows
You May Also Like: Nine of the Best Props to Add Impact to Your Presentation | Dry Fruits (General) PowerPoint Templates


Microsoft and the Office logo are trademarks or registered trademarks of Microsoft Corporation in the United States and/or other countries.