Learn about chart elements in PowerPoint 2007 for Windows. These chart elements include Series, Categories, Axes, Plot area, Legend, Chart Title, and many more.
Author: Geetesh Bajaj
Product/Version: PowerPoint 2007 for Windows
OS: Microsoft Windows XP and higher
Charts in PowerPoint comprise several elements that we call Chart Elements. Typical chart elements include:
In this tutorial, we'll learn more about these individual chart elements. Before starting, we are assuming you already have a chart inserted on a PowerPoint slide. If not, check out this page that shows how you can place a new chart on a slide in PowerPoint 2007 for Windows.
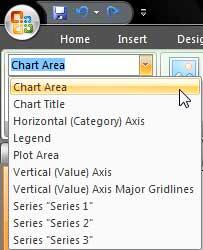
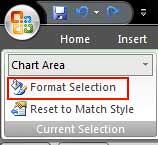
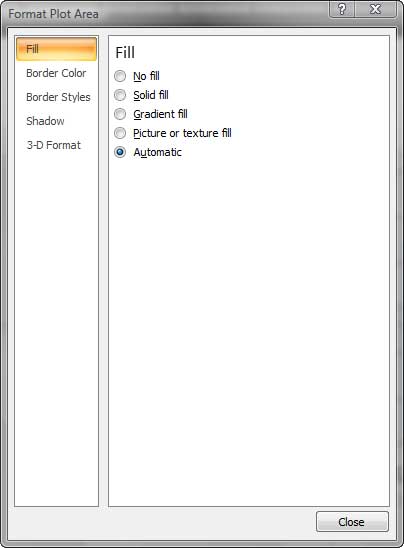
Follow these steps to select individual chart elements.


Although different charts have differing chart objects, these are the common chart objects found in almost all chart types:
Most charts have two axes:
Some charts may also have a Z axis. Learn more about PowerPoint's chart axes.
The area within the axes is known as the plot area. The plot area includes the series, gridlines, etc. And the legend and titles are normally placed outside the plot area.
Most of the time, you may see horizontal gridlines but vertical gridlines are also available, and both of them can be formatted as required.
There are two types of titles:
Getting into datasheet mode in PowerPoint 2007 translates to launching Microsoft Excel with your data available to edit, add, remove, etc. This Excel sheet contains the values based on which the chart is created. In case you find yourself in a rare situation where you have PowerPoint 2007 installed without Excel 2007, then you'll see the regular Microsoft Graph datasheet that was the norm in the days of PowerPoint 2003 and previous versions.
Every column of data within the data that's shown as a component of the chart is known as a Series.
A set of Series can be represented as a Category.
These are the individual figures that identify each series. The font and placement for these can be formatted.
This is a box placed normally outside the plot area which provides captions (and/or color coding) to the series, and helps identifying the series. Legends are automatically created with the chart itself, although you can opt to remove the legend.
See Also:
Chart Basics: Chart Elements (Glossary Page)
Chart Elements in PowerPoint 2013 for Windows
Chart Elements in PowerPoint 2011 for Mac
Chart Elements in PowerPoint 2010 for Windows
Chart Elements in PowerPoint 2003 and 2002 for Windows
You May Also Like: Business Storytelling: Conversation with Gavin McMahon | Army PowerPoint Templates


Microsoft and the Office logo are trademarks or registered trademarks of Microsoft Corporation in the United States and/or other countries.