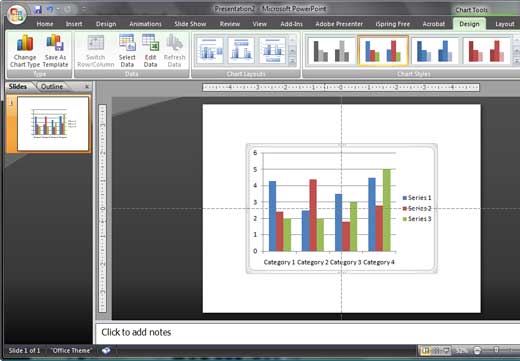
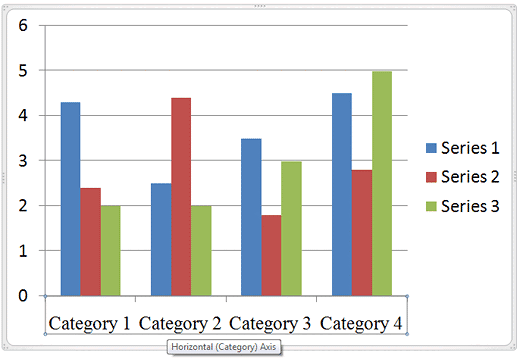
Learn about formatting fonts within charts in PowerPoint 2007 for Windows. You can change font, font size, and other formatting attributes within PowerPoint charts.
Author: Geetesh Bajaj
Product/Version: PowerPoint 2007 for Windows
OS: Microsoft Windows XP and higher
Although charts are a visual medium, they still contain plenty of text in the form of data labels, titles, legend, axis labels, etc. And while PowerPoint 2007 does make it simpler to access text formatting options than in previous PowerPoint versions, there's still some learning involved. That sort of learning is exactly what this tutorial aims to provide.
Follow these steps to change font and other text options for charts in PowerPoint 2007 for Windows:


See Also:
Advanced Chart Techniques: Changing Fonts and Other Text Options for Charts (Glossary Page)
Changing Fonts and Other Text Options for Charts in PowerPoint 2013 for Windows
Changing Fonts and Other Text Options for Charts in PowerPoint 2011 for Mac
Changing Fonts and Other Text Options for Charts in PowerPoint 2010 for Windows
Changing Fonts and Other Text Options for Charts in PowerPoint 2003 and 2002 for Windows
You May Also Like: 7 Ways To Get Business Networking Really Wrong | Alcohol PowerPoint Templates


Microsoft and the Office logo are trademarks or registered trademarks of Microsoft Corporation in the United States and/or other countries.