Although charts are a visual medium, they still contain some text in the form of data labels, titles, legend, axis labels, etc. You may need to format the chart text to suit your requirements. While PowerPoint 2011 for Mac makes it simpler to access text formatting options than in previous PowerPoint versions, there's still some learning involved. That sort of learning is exactly what this tutorial aims to provide.
Follow these steps to format fonts within charts in PowerPoint 2011 for Mac:
- First of all insert a chart on your slide. Then, select the chart so that you can see the Chart Layout and Format tabs on the Ribbon, as shown highlighted in red within Figure 1, below.
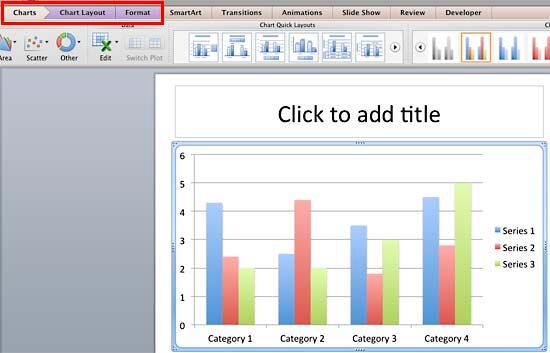
Figure 1: Chart selected Contextual tab
- The Chart Layout and Format tabs are Contextual tabs. These tabs are special tabs in the Ribbon that are not visible all the time. They only make an appearance when you are working with a particular slide object which can be edited using special options.
- When you select the chart, the entire chart area gets selected. If you want to change the font or text attributes for a particular chart element, you'll have to click on that element to select it. You can also select any chart element using the Current Selection box within either the Chart Layout, or Format tabs of the Ribbon. In Figure 2, below you can see that the Horizontal Category Axis (the axis below the plot area) has been selected.
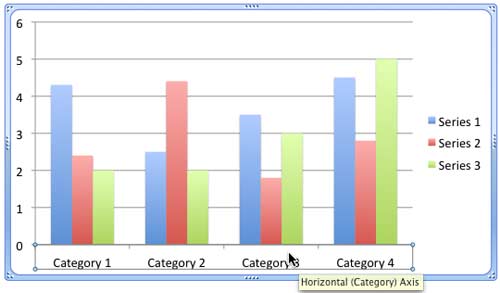
Figure 2: Horizontal Category Axis selected - Now, you can change font and text formatting within this axis in any of these three ways:
- You can use text formatting options within Formatting Toolbar, as shown highlighted in red within Figure 3, below. To learn more about the text formatting options within Formatting Toolbar, read our Formatting Toolbar in PowerPoint 2011 for Mac tutorial.

Figure 3: Formatting Toolbar in PowerPoint 2011 - If you want to apply some styles and effects to the selected text, click on the Format tab of the Ribbon, as shown highlighted in red within Figure 4, below. Within this tab, locate the Text Styles group that you can see in Figure 4. This group includes the Quick Styles gallery, as shown highlighted in blue within Figure 4, that provides you with some ready-made WordArt styles for the selected text. To learn more about how to apply these ready-made WordArt styles, refer to our WordArt Styles (Quick Styles) in PowerPoint 2011 for Mac tutorial.

Figure 4: Text formatting options within the Text Styles group of the Format tab - You can also summon the Format Text dialog box which includes all possible text formatting options. To do so, right-click (or Ctrl+click) on the selection and from the contextual menu that appears, select the Format Text option, as shown in Figure 5, below.
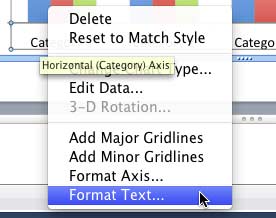
Figure 5: Format Text option selected - Alternatively, you can choose the Format | Font menu option. Either way, you will bring up the Format Text dialog box that you can see in Figure 6, below. This dialog box includes all possible text editing options such as changing the font, text fill, text line, effects etc.
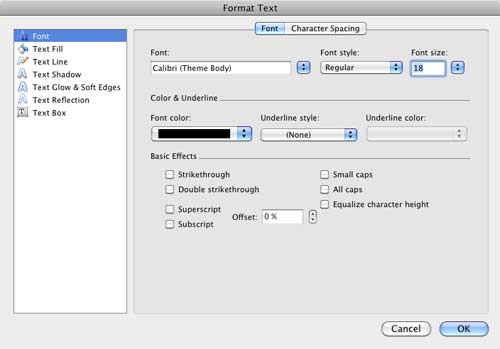
Figure 6: Format Text dialog box
- Make any changes to the font and text formatting as required. Figure 7, below, shows the selected Horizontal Category Axis after changing some text attributes (compare Figures 7 and 1).
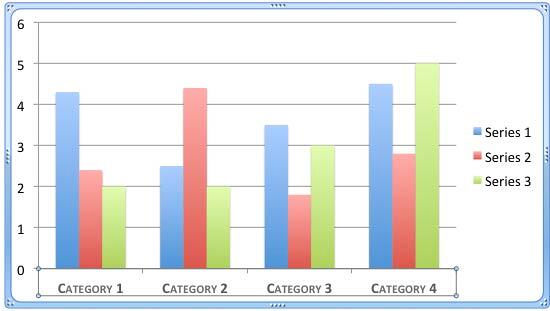
Figure 7: Selected Chart text formatted - Save your presentation.


