Indezine Logo


Changing Fonts and Other Text Options for Charts in PowerPoint 2003 and 2002 for Windows

Learn about formatting fonts within charts in PowerPoint 2003 and 2002 for Windows. You can change font, font size, and other formatting attributes within PowerPoint charts.


Author:

Product/Version: PowerPoint 2003 and 2002 for Windows

OS: Microsoft Windows XP and higher


Learn PowerPoint

How to create Simple Quizzes in PowerPoint


You can create the most amazing charts without any text since the main purpose of any chart is to show a trend. Having said that, text plays a very important role in charting, and although we do recommend you keep text at a minimum, you'll end up with some text in the form of the legend, some data labels, axis titles, etc. Having said so, nothing looks as bad as text that is too small or too huge on a chart, and balance plays a key role in the aesthetics of text in a chart. Yet many people don't know how you can format text in a chart.

On this page, we'll explore techniques for working with text within charts in PowerPoint 2002 and 2003 for Windows.

We already showed you how you can change chart types, and how you can change fills and outlines for chart data series. The next thing you should do with your chart is fine-tune any text, and that's what we show you now. Before you proceed, you need to have a chart in your presentation. You can learn how you can insert chart in PowerPoint 2002 or 2003.

Follow these steps to change font and other text options in PowerPoint 2002 and 2003 for Windows.

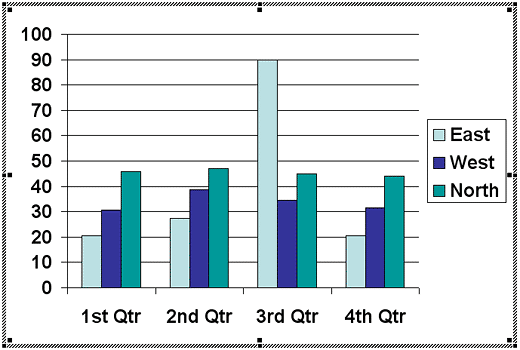
  1. Double-click your chart to be in PowerPoint's chart editing mode, as shown in Figure 1, below.
  2. Chart editing mode
    Figure 1: Chart editing mode
  3. You'll see a herringbone patterned border around your chart as shown in Figure 2, below. This border indicates you are in the chart editing mode. You can now individually select any chart element that contains text.
  4. Select chart
    Figure 2: Select chart
  5. Choose the Format | Selected Data Series menu option, as shown in Figure 3, below.
  6. Selected Data Series
    Figure 3: Selected Data Series
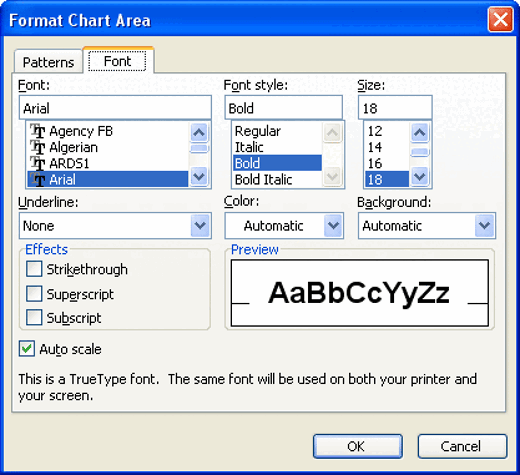
  7. This action summons the Format dialog box based on the chart element you have selected, as shown in Figure 4, below. Select the Font tab in the resultant dialog box, your dialog box may look a little different than what you see in Figure 4 depending upon the chart element you selected.
  8. Format Chart Area
    Figure 4: Format Chart Area
  9. Within the Font tab of the dialog box, you'll find these options:
  10. Auto scale

  11. This check-box is selected by default, and in our opinion this is the biggest culprit for any jagged fonts that you see in your charts. Disable this option before you do anything else in this dialog box! So what does this Auto scale option do? It automatically scales your font sizes without asking you. If you reduce the size of your chart, Auto scale might reduce the size of your font from 12 points to 7.67 points or some other strange number.
  12. Fonts

  13. Here, you get all the font types that are installed in your system, and you can change the type of font you want to use. Make sure that the font you use is the same as what you are using for other chart elements and also the same as the one you use for all other text in your presentation.
  14. Font Style

  15. Here, you can choose font styles such as bold, italics, bold italics, etc.
  16. Size

  17. You can set the font size by its number in points.
  18. Underline

  19. You can enable underlining for the selected text, and choose from single or double underlines.
  20. Color

  21. Click the downward pointing arrow to bring up a color gallery from where you can choose any color you want. By default, the text in your chart is set to Automatic color.
  22. Background

  23. This provides three options: Automatic, Transparent, and Opaque. The Transparent option shows the slide background whereas the Opaque option shows a colored background, and the color may be white.
  24. Effects

  25. You can choose from font effects such as Strikethrough, Superscript and Subscript.
  26. Preview

  27. Here you can see a small preview of the text with the changes applied.
  28. When done, click the OK button to get back to the chart.
  29. You can exit the chart editing mode by clicking anywhere outside the chart area or the datasheet.
  30. Save your presentation.

The techniques explained on this page apply to any text in your charts within PowerPoint 2002 and 2003.


See Also:

Advanced Chart Techniques: Changing Fonts and Other Text Options for Charts (Glossary Page)

Changing Fonts and Other Text Options for Charts in PowerPoint 2013 for Windows
Changing Fonts and Other Text Options for Charts in PowerPoint 2011 for Mac
Changing Fonts and Other Text Options for Charts in PowerPoint 2010 for Windows
Changing Fonts and Other Text Options for Charts in PowerPoint 2007 for Windows

You May Also Like: How to Disagree Constructively | Acorn Squash PowerPoint Templates


Popular Posts

Creating Slide Backgrounds in Photoshop for PowerPoint
Learn how to create slide backgrounds for PowerPoint in Photoshop.

Formatting Arrows (Arrowheads) in PowerPoint 2016 for Windows
Learn how to format arrowheads for lines in PowerPoint 2016 for Windows.

Creating Semi-Circles in PowerPoint 2013
Learn how to create a semi-circle in PowerPoint 2013.

Apply Two or More Animations to One Object at the Same Time in PowerPoint
Apply multiple animations to one slide object in PowerPoint, and make all animations play together.


Organic Shapes with Brush Edges

You get 8 shape types plus lines as part of this Organic Shapes collection. Each of these 8 shape types have 10 variants. So you end up with 80 hand-drawn shape options! Again each of these 80 shapes have 12 brush stroke styles! Plus you get the lines and arrows in 12 brush stroke styles too. Combine all variations to end up with more than 3000 possibilities.

Buy and Download for $99+ (83 MB)


Microsoft and the Office logo are trademarks or registered trademarks of Microsoft Corporation in the United States and/or other countries.

Home | PowerPoint | Photoshop | PowerPoint Templates | PowerPoint Tutorials | Blog | Notes | Ezine | Media Kit | Feedback | Site Map | About Us | Contact Us

Link to Us | Privacy | Testimonials

PowerPoint Backgrounds | Christian PowerPoint Backgrounds | Business PowerPoint Presentation Templates

Plagiarism will be detected by Copyscape

©2000-2025, . All rights reserved.