Indezine Logo


Inserting Charts in PowerPoint 2003 for Windows

Learn how you can insert a chart in PowerPoint 2003 for Windows. While inserting, you can choose the chart type you want to insert.


Author:

Product/Version: PowerPoint 2003 for Windows

OS: Microsoft Windows XP and higher


Learn PowerPoint

Presentation Management 05: Why Is It Important Now


Follow these steps to insert a chart (or graph) within a slide in PowerPoint 2003 for Windows:
  1. Create a new presentation in PowerPoint, or open an existing presentation.
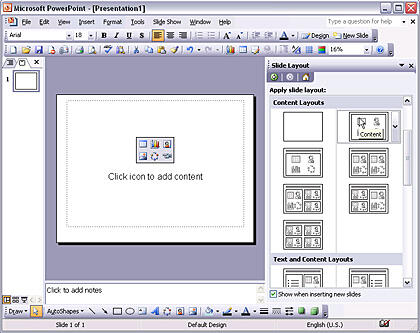
  2. Insert a new slide by choosing the Insert | New Slide option (Ctrl+M). This will also activate the Slide Layout Task Pane as shown in Figure 1. Within this Task Pane, select either the Content or Title and Content layout.
  3. PowerPoint Interface with blank layout
    Figure 1: PowerPoint Interface with blank layout
  4. One of the six icons in the Content placeholder that you can see in the slide within Figure 1 above, is the Insert Chart icon. Click this icon to insert a new chart on your slide.
  5. Alternatively, if you want to insert a chart in an existing slide that has no content placeholder, just choose the Insert | Chart option, as shown in Figure 2 below.
  6. Insert Chart
    Figure 2: Insert Chart
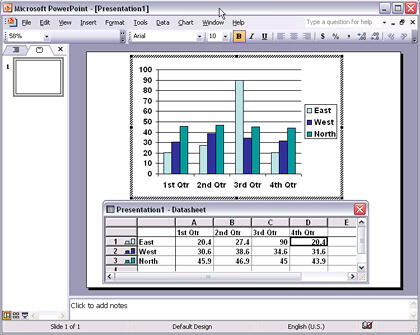
  7. Either way, you'll end up with a column chart based on dummy data. You can thereafter change both the chart type and the dummy data on which the chart is based.
  8. Both the chart and the datasheet that contains the dummy data can be seen in Figure 3.
  9. Tip: Note that the menu bar in PowerPoint now has two new menu options: Data and Chart. This means that you are now in chart editing view. To come out of chart editing view, just click anywhere outside the chart area or datasheet.
  10. Chart with datasheet
    Figure 3: Chart with datasheet
  11. If you have worked with Microsoft Excel, or another spreadsheet program, the datasheet will look familiar, as you can see in Figure 4.
  12. Datasheet
    Figure 4: Datasheet
  13. Change the dummy data values within the datasheet with your own values. Follow these guidelines:
    1. Select a cell in the datasheet, and type in a new value.
    2. You can move to the cell towards the right in the datasheet by pressing the Tab key. Or, move to the cell below by pressing the Enter(Return) key.
    3. To insert a new column in the datasheet, right-click the header of the next column and choose the Insert option.
    4. To insert a new row in the Excel sheet, right-click the header of the next row and choose the Insert option. Remember, column or row content inserted this way ends up as a new series value in your chart.
    5. You can also delete columns and rows. Just select the row or column header, right-click, and choose the Delete option.
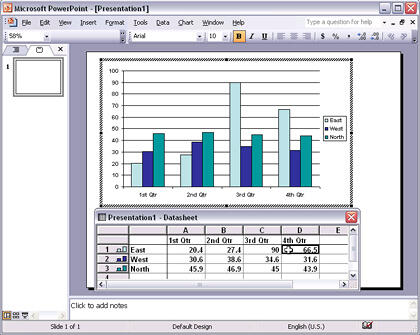
  14. Once you change, add, or remove cell values, the corresponding column (or another element in a different chart type) will change. In our column chart example, shown in the Figure 5 the change of value in cell D1 made the corresponding column noticeably taller.
  15. Datasheet values
    Figure 5: Datasheet values
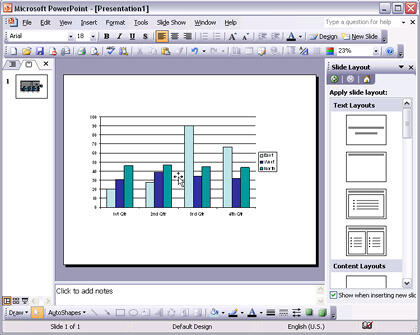
  16. After inserting or changing the cell values in the datasheet, you can exit the work window by clicking anywhere outside the chart area or the datasheet. The datasheet and the border around the chart will disappear as shown in the Figure 6. You'll also no longer find the Data and Chart menu options in PowerPoint (refer to Figure 5). This means you are no longer in the chart editing view.
  17. Inserted Chart
    Figure 6: Inserted Chart
  18. To make any more changes to the chart, double-click it so that you can summon the chart editing view with the datasheet again.

See Also:

Chart Basics: Inserting Charts (Glossary Page)

Inserting Charts in PowerPoint 2016 for Windows
Inserting Charts in PowerPoint 2013 for Windows
Inserting Charts in PowerPoint 2011 for Mac
Inserting Charts in PowerPoint 2010 for Windows
Inserting Charts in PowerPoint 2007 for Windows

You May Also Like: Hypersay with Live Subtitles: Conversation with Brian Daly | South Asian Association for Regional Cooperation (SAARC) PowerPoint Templates


Popular Posts

Shapes
Shapes
Learn how you can create and manipulate shapes in PowerPoint -- knowledge of working with shapes is significant because they are the building blocks of creativity in PowerPoint.

Insert Picture from the Office ClipArt Collection in PowerPoint 2013
Learn how to insert picture using Office ClipArt in PowerPoint 2013.

Snow Effect in PowerPoint
Create a snow fall effect inside PowerPoint using animation techniques.

PowerPoint Transitions: Curtains
Explore the Curtains transition effect in PowerPoint.


Feature List 01 (Layout with Tabs)

The Feature List Layout comprises three sample PowerPoint presentations: one each to create a visual list for 4 features, 5 features, and 6 features. These work great when you have too much information to fit within one slide. This solution lets you use multiple slides, but the visual result is still that of one single slide!

Buy and Download Feature List 01 (Layout with Tabs) for $4.99+ (671 kb)

This is the original page. An AMP (Accelerated Mobile Page) version of this page is also available for those on mobile platforms, at Inserting Charts in PowerPoint 2003 for Windows.


Microsoft and the Office logo are trademarks or registered trademarks of Microsoft Corporation in the United States and/or other countries.

Home | PowerPoint | Photoshop | PowerPoint Templates | PowerPoint Tutorials | Blog | Notes | Ezine | Media Kit | Feedback | Site Map | About Us | Contact Us

Link to Us | Privacy | Testimonials

PowerPoint Backgrounds | Christian PowerPoint Backgrounds | Business PowerPoint Presentation Templates

Plagiarism will be detected by Copyscape

©2000-2023, Geetesh Bajaj. All rights reserved.