Creating a waterfall chart in PowerPoint without using the think-cell add-in is doable, but it can be more time-consuming and include fewer features than using think-cell, as it requires manual editing of both the data and formatting.
If you are looking for a more straightforward, quicker, and efficient solution that you can reuse often, then downloading think-cell is a great solution that will help you create over 40 chart types.
Sharing think-cell Charts with Others
Yes, you can share think-cell charts with others who do not have think-cell installed, and the charts will appear to them as native PowerPoint charts. They may not have the editing ability but they can still see the chart in full fidelity as you intended. To edit those charts, they will need to download and install think-cell.
Follow these steps to create a waterfall chart using think-cell:
- If you do not already have think-cell installed, you can download and install the think-cell add-in for PowerPoint. A free 30-day trial is available if you want to try think-cell.
- Once think-cell is installed, launch PowerPoint. Add a new slide and then access the Insert tab on the Ribbon. Locate the think-cell group, and click on the Elements button, as shown highlighted in red within Figure 1, below.

Figure 1: think-cells' Elements button- This action brings up a drop-down menu, as shown in Figure 2, below. You will find two options to create a waterfall chart here: Build-up Waterfall and Build-down Waterfall.
- The Build-up option is like the conventional waterfall chart that ends up with the Total column on the far right. The Build-down option works similarly, but begins with the Total column in the first, leftmost position. We chose the Build-up Waterfall option, as shown highlighted in red within Figure 2.
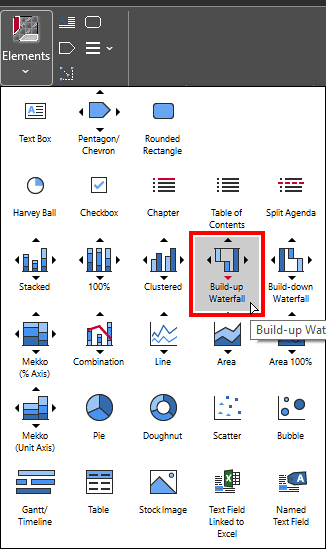
Figure 2: Build-up Waterfall- think-cell will now be active, and you will have to click on the slide to insert a new waterfall chart. When inserted, you will see a dummy chart, plus a data window, as shown in Figure 3, below. The data window is an instance of Excel.
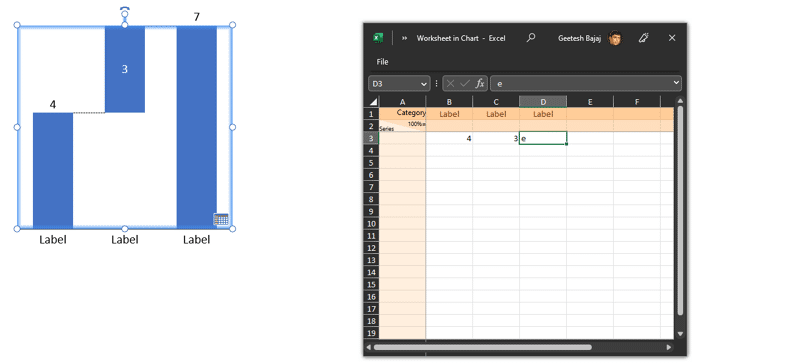
Figure 3: Dummy chart with data in think-cell- Enter your data into the think-cell data window. You can specify the starting value, the in-between values, total values, and the ending value for each column in the chart. Do note that you need not calculate or set columns for total or end values. Just type in the character e in the data window for that column, as shown highlighted in red within Figure 4, below. think-cell will automatically calculate total values as needed.
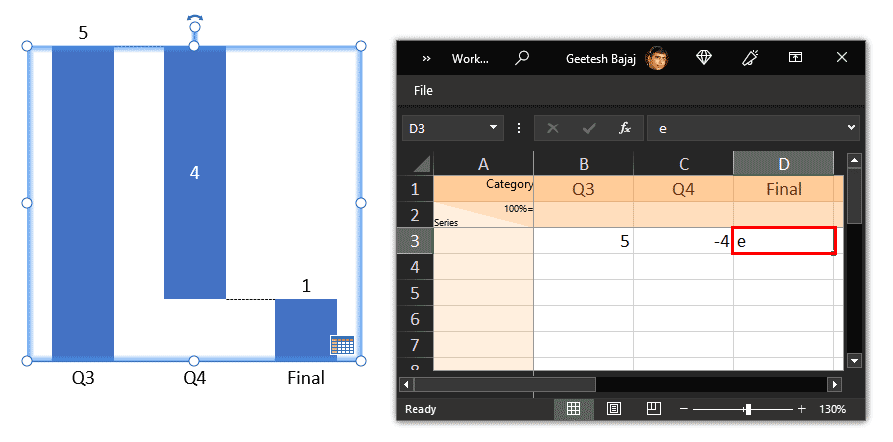
Figure 4: think-cell will automatically calculate values- You can format the chart as desired, including changing column colors and labels. You can also add, remove, and format connectors. think-cell adds connectors by default that are anchored to the top or the bottom of the columns. However, you can change the beginning and ending anchor points of each connector individually. To do so, you click on an individual connector so that it shows two selection points, as shown in Figure 5, below.
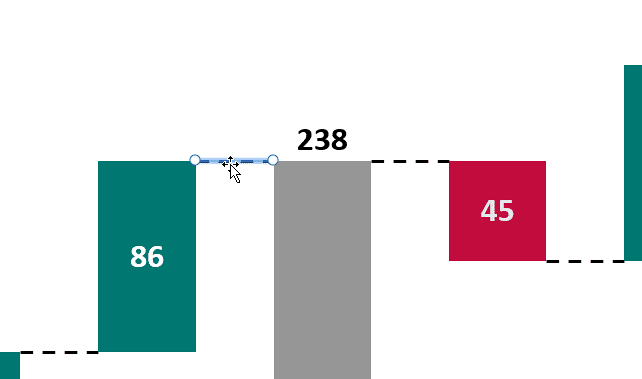
Figure 5: Select connector- You then drag any one of these selection points. As you do so, all possible anchor points for other columns get almost magnetized and show up in red, as shown in Figure 6, below.
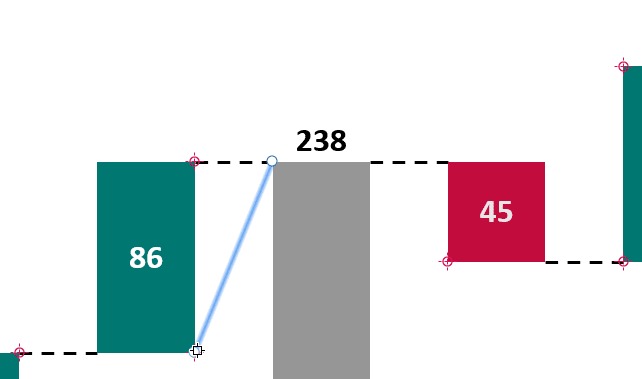
Figure 6: Magnetized connector- You then drop the selected point to any of these anchor points. Figure 7, below, shows the updated chart that you can compare with the chart shown previously on this page in Figure 5. As you can see, moving connectors is something you need to do with so much thought, since this activity may change the meaning of your waterfall chart altogether. Conversely, this is also a powerful feature that will allow you to add more meaning and retell the story of value fluctuations in an interesting manner.
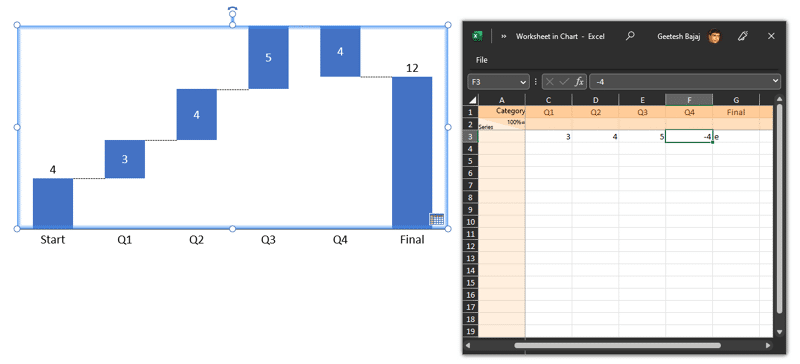
Figure 7: Updated think-cell chart- To make the story more interesting for your audience, you can also add annotations within think-cell such as difference arrows, total difference arrows, CAGR arrows, value lines, etc. Make sure to add only a few of these annotation features so that your chart appears clean and uncrowded.
What are the benefits of using think-cell to create waterfall charts rather than using native PowerPoint options?
While you can use PowerPoint to create waterfall charts, there are several benefits to using think-cell. Here are some of these advantages:
- Ease of use: think-cell provides a simpler, more intuitive interface for creating and editing waterfall charts in PowerPoint. Most options work the same way for different chart types in think-cell. Thus, if you know how to create a waterfall chart, you can create almost any other chart type by using the same or similar steps.
- Editing: It’s so much easier to edit waterfall charts created using think-cell because everything is automated and there are no workarounds or extra steps needed.
- Customization: think-cell provides options for customizing the appearance of your waterfall charts. Many extra features are available to attain expected chart outcomes.
- Branding: think-cell is more brand aware and lets you use your company colors and standards.
- Waterfall chart variations: think-cell allows you to create Build-down Waterfall charts as well. With native PowerPoint charts, you can only create Build-up Waterfall charts.
All put together, using think-cell lets you use your time and energy on other important things rather than struggling to create waterfall charts. And waterfall charts are probably just the tip of the iceberg as far as think-cell’s repertoire is concerned.


