Learn how to add effects to the Chart Area in PowerPoint 2013 for Windows. These effects must be used sparingly, as far as possible.
Author: Geetesh Bajaj
Product/Version: PowerPoint 2013 for Windows
OS: Microsoft Windows 7 and higher
There are plenty of ways to make the Chart Area stand out on your slide. One method is to use the Fill and Line options to apply a fill and/or a border to the Chart Area. Additionally you can also apply any of the Effects that PowerPoint 2013 for Windows provides.
Now, follow these steps to learn about the various Effects that can be applied to the Chart Area:
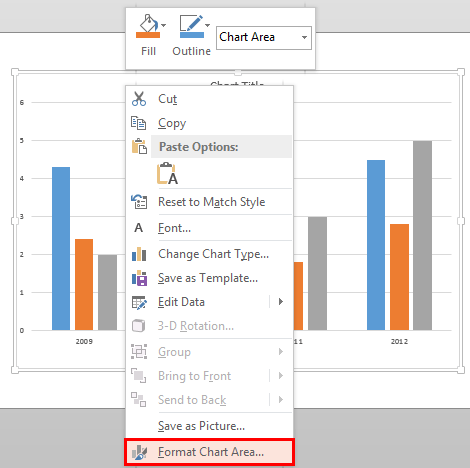
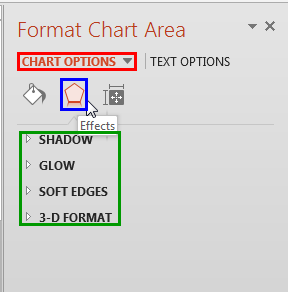
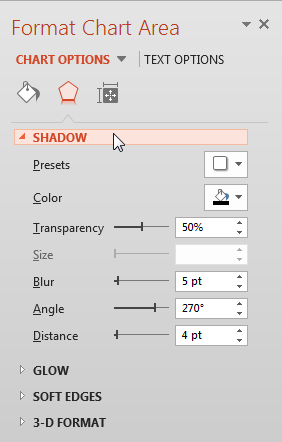
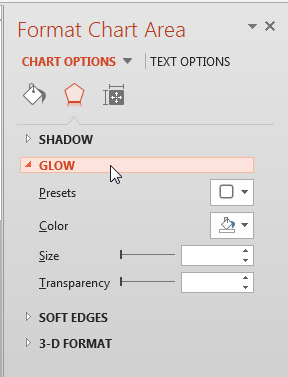
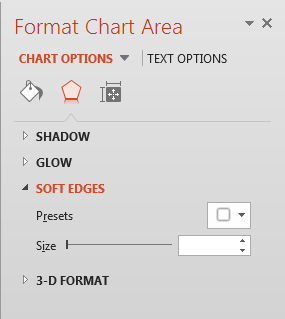
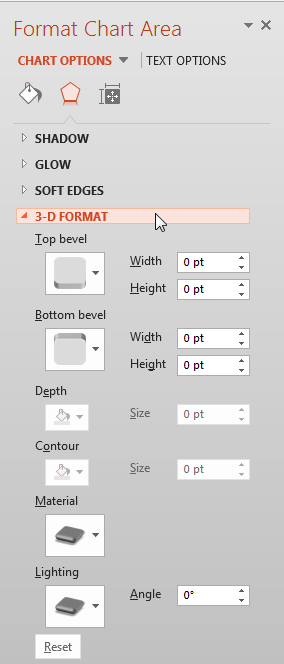
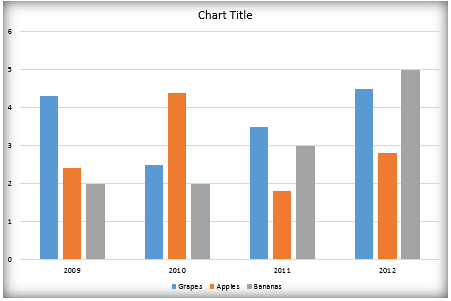
Chart Area: Effect Options for the Chart Area (Glossary Page)
You May Also Like: 3D Content Guidelines for Microsoft: Conversation with Michelle Maislen and Jeremy Kersey | Tartan PowerPoint Templates


Microsoft and the Office logo are trademarks or registered trademarks of Microsoft Corporation in the United States and/or other countries.