In the charts you create within PowerPoint, the Chart Area doesn't show any fill or any kind of formatting unless you have applied a particular Chart Style. In fact the Chart Area is completely transparent with no fill or outline attribute. This default status works well most of the time because the Chart Area is the backdrop area, and all chart elements are placed over it—so the lack of any formatting makes things simpler. However, you can opt to format this area as required. This is quite easy and entails just a few clicks.
Follow these steps to explore more in PowerPoint 2011 for Mac:
- Select the chart that you want to format the Chart Area for. If you don't have a chart, insert a chart. You can also change the chart type from one to another.
- Now, select either the Chart Layout or the Format tab of the Ribbon. Both these tabs contain the Current Selection group that you can see in Figure 1 towards the extreme left. Within this group, you can see the Chart Elements selection box (highlighted in red within Figure 1). This selection box contains a list of elements in the selected chart. Within this list, click on the Chart Area option. Now, you can see a tick mark prefixed to this option, as shown in Figure 1 to indicate its selected status.
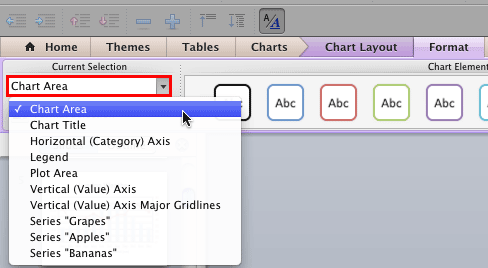
Figure 1: Chart Area selected Note: The
Chart Layout and
Format tabs are
contextual tabs. These tabs are special tabs in the
Ribbon that are not visible all the time. They only make an appearance when you are working with a particular slide object which can be edited using special options.
- Below this Current Selection list is the Format Selection button, as shown highlighted in red within Figure 2. Click this button.
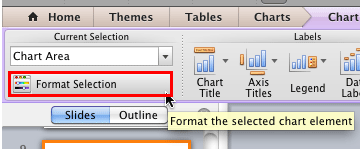
Figure 2: Format Selection button - Alternatively, carefully right-click (or Ctrl+click) the Chart Area (click close to the edge of your chart). From the contextual menu that appears, select the Format Chart Area option as shown in Figure 3.
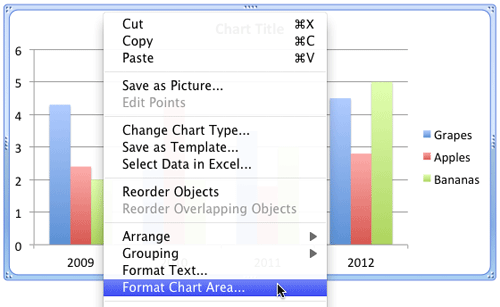
Figure 3: Chart Area option selected - Either way, you summon the Format Chart Area dialog box as shown in Figure 4.
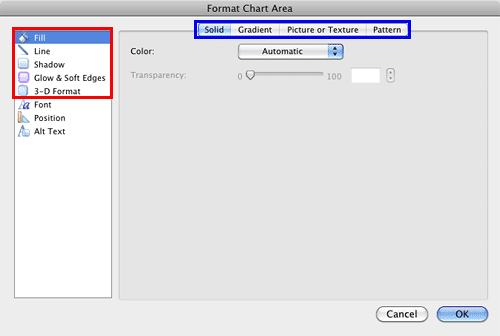
Figure 4: Format Chart Area dialog box - In this dialog box, the top five options within the sidebar (highlighted in red within Figure 4, above) help you to format the appearance of the Chart Area. Let us explore each of them. For more information on each of these options, refer to the tutorials linked. Even though these linked tutorials are related to Shapes, the same techniques work with the Chart Area too:
Fill
- This option is used to fill the Chart Area with a fill type such as Solid, Gradient, Picture or Texture, or Pattern (highlighted in blue within Figure 4, above). Select one of the tabs depending upon the fill type required. To learn more about these options, refer to our Fills for Shapes in PowerPoint 2011 for Mac tutorial.
Line
- Selecting this option will bring up three tabs: Solid, Gradient, and Weight & Arrow as shown in Figure 5 (highlighted in red).

Figure 5: Line options within the Format Chart Area dialog box - By default you can't see any boundary line around the Chart Area. But, using the options within these tabs you can add a nice outline to your Chart area. Get more info on how to add and edit lines in our Formatting Lines (and Shape Outlines) in PowerPoint 2011 for Mac tutorial. Remember though that you can't use the Arrow options with Chart Area since it is not an open shape.
Shadow
- Adds a shadow to the Chart Area. When you select this option, you will see that all options are greyed out except the Shadow check-box (highlighted in red within Figure 6).
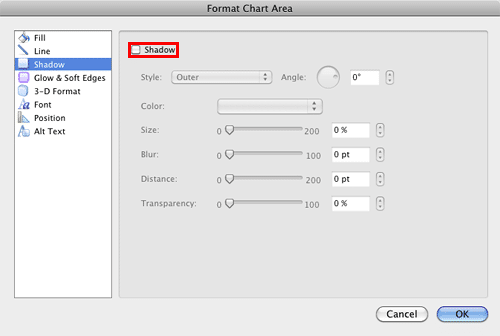
Figure 6: Shadow options within the Format Chart Area dialog box - Selecting the Shadow check-box activates all options, so that you can add a shadow to the Chart Area and format it as required. Learn more about these options in our Advanced Shadow Effect Options in PowerPoint 2011 for Mac tutorial.
Glow & Soft Edges
- Glow effect adds a nice halo around the selected Chart Area whereas the Soft Edges effect adds an eaten-up, feathered edge to the selected Chart Area. Select any of the options that you can see in Figure 7, as required.
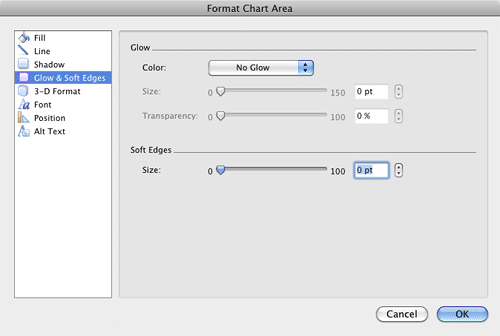
Figure 7: Glow & Soft Edges options within the Format Chart Area dialog box - Get more info on how to Apply Glow Effects to Shapes in PowerPoint 2011 for Mac and Apply Soft-Edges to Shapes in PowerPoint 2011 for Mac.
- Note: Remember that you cannot see the effect of applying the Glow & Soft Edges options on the Chart Area until you change its fill to any of the fill types.
3-D Format
- The Bevel effect can make your Chart Area look embossed, like a button, or even a pillow. There are plenty of 3-D Format options for your Chart Area as shown in Figure 8.
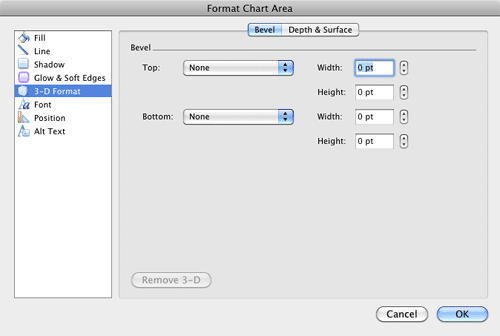
Figure 8: 3-D Format options within the Format Chart Area dialog box - Learn more about 3D Format in our Bevel (3-D Format) Options for Shapes in PowerPoint 2011 for Mac tutorial.
- Select the required options and format the Chart Area as required. In Figure 9, you can see that our sample chart with formatted Chart Area includes a picture fill, and also has an outline (compare with the partial chart in Figure 3).
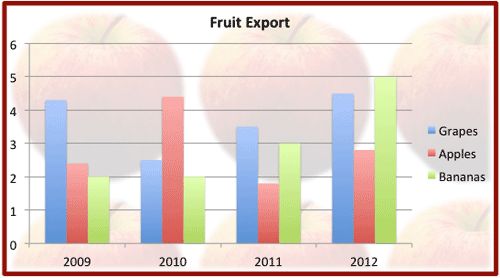
Figure 9: Chart Area with changed appearance - Save your presentation often.


