Learn how you can add an organization chart in PowerPoint 2013 for Windows. Organization charts are perfect to display management or hierarchical structures.
Author: Geetesh Bajaj
Product/Version: PowerPoint 2013 for Windows
OS: Microsoft Windows 7 and higher
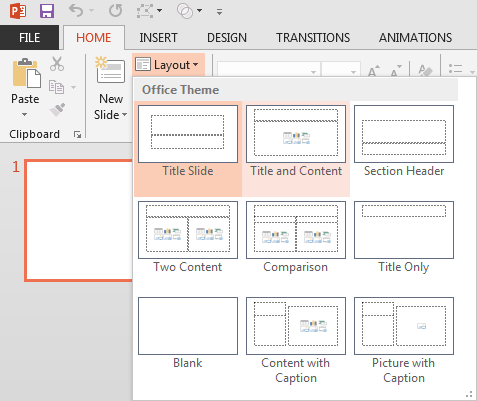
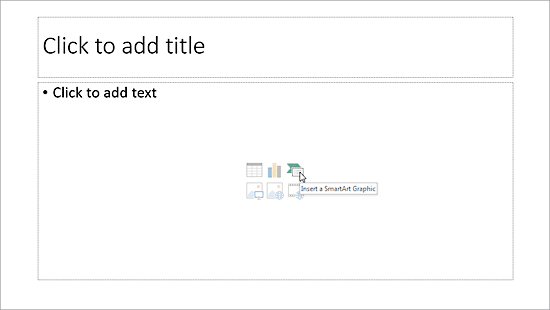
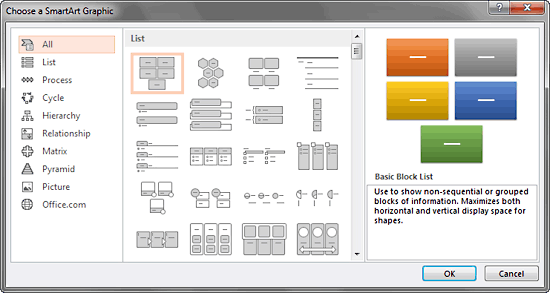
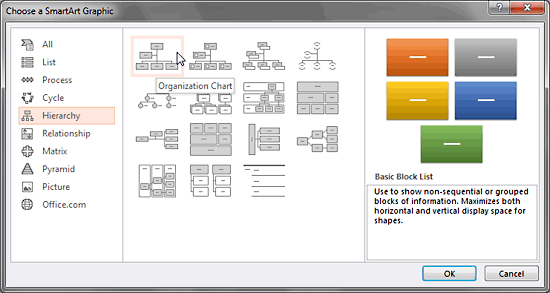
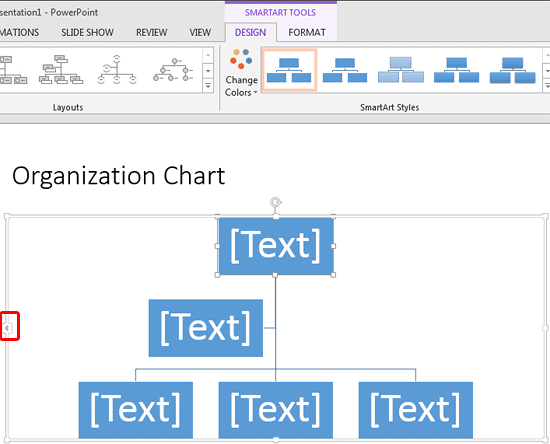
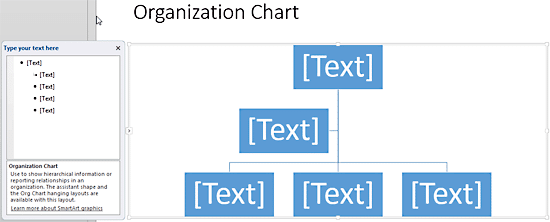
You won’t find an option to add an organization chart in PowerPoint 2013’s Insert tab of the Ribbon. Instead, you will find the SmartArt option in the same tab, and organization charts are just one of the many variants of SmartArt graphics you can insert into your slide. An organization chart graphically represents the management or hierarchical structure of an organization. If you want to illustrate the reporting relationships in your company or organization, you can easily create an organization chart.
Follow these steps to insert an organization chart using SmartArt in PowerPoint 2013 for Windows:

Do you want more keyboard shortcuts?
Explore our PowerPoint Keyboard Shortcuts and Sequences Ebook that is updated for all PowerPoint versions.

Learn how to add more shapes to your organization chart in our Adding New Shapes to Existing Organization Charts in PowerPoint 2013 tutorial.
See Also:
11 04 01 - Organization Charts: Insert an Organization Chart (Glossary Page)
Insert an Organization Chart in PowerPoint 2011 for Mac
Insert an Organization Chart in PowerPoint 2010 for Windows
You May Also Like: Powtoon: Conversation with Ronen Baran | Salad PowerPoint Templates


Microsoft and the Office logo are trademarks or registered trademarks of Microsoft Corporation in the United States and/or other countries.