Indezine Logo


Chart Styles in PowerPoint 2013 for Windows

Apply predefined Chart Styles to your charts in PowerPoint 2013 for Windows. With one click, predefined combinations of various chart elements can be easily applied.


Author:

Product/Version: PowerPoint 2013 for Windows

OS: Microsoft Windows 7 and higher


Learn PowerPoint

Presentation Management 11: How Presentation Management Transforms Content


Making a chart look different involves so much because each chart has almost 10 or more elements that contribute to its appearance. If you start formatting all these 10 elements individually, it will take a long time to get results. And the same attributes will be difficult to apply to any other chart within the same presentation. The saviour in this case can be the amazing Chart Styles option in PowerPoint 2013. These Chart Styles include predefined combinations for various chart elements and include effects and layouts that can change the look of your chart completely. And, all these styles are based on Office Themes. Just a couple of clicks can make your charts look distinctive.

To apply a Chart Style, you first need to have a chart in your presentation. Learn how to insert a chart in PowerPoint 2013, and then follow these steps to apply a chart style in PowerPoint 2013 for Windows:
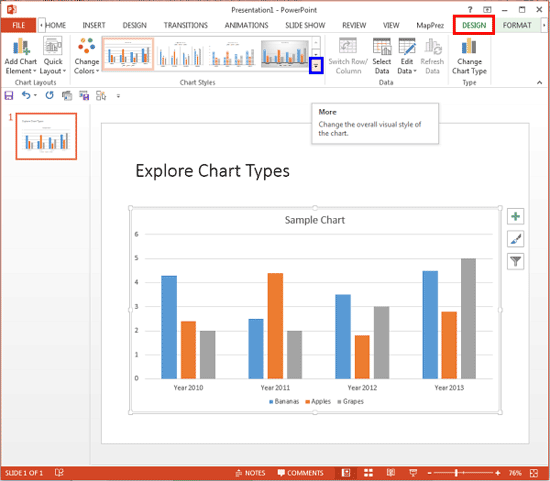
  1. Select the chart to which you want to apply a chart style. Doing so will bring up the Chart Tools Design and Format contextual chart tabs on the Ribbon, as shown in Figure 1. Select the Design contextual chart tab (highlighted in red within Figure 1). Locate the Chart Styles group, and click the downward pointing arrow (highlighted in blue within Figure 1).
  2. Design tab for the Chart selected
    Figure 1: Design tab for the Chart selected
  3. Note: The Design and Format tabs are Contextual tabs. These tabs are special tabs in the Ribbon that are not visible all the time. They only make an appearance when you are working with a particular slide object which can be edited using special options.
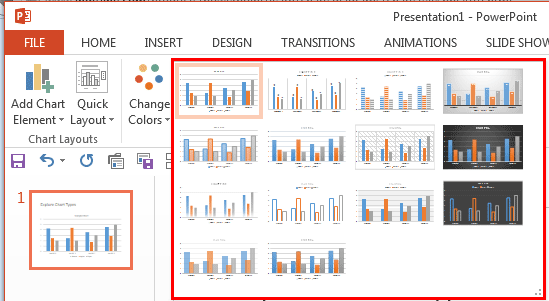
  4. Doing so opens the Chart Styles gallery, as shown in Figure 2 (highlighted in red).
  5. Chart Styles gallery
    Figure 2: Chart Styles gallery
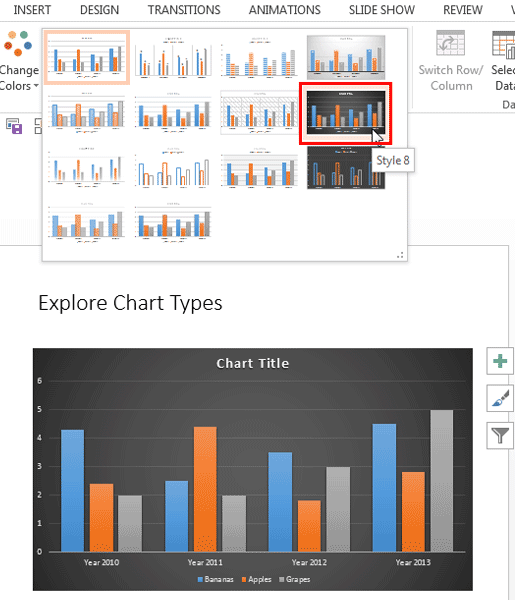
  6. Hover your cursor on any chart style preview thumbnail as shown highlighted in red within Figure 3, and you can see the Live Preview of that Chart Style on the chart selected on your slide, as shown in Figure 3.
  7. Chart showing the live preview
    Figure 3: Chart showing the live preview
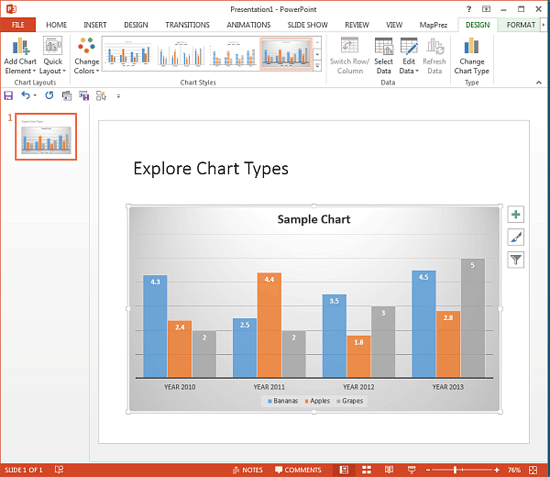
  8. Explore all Chart Styles and decide which one works best for you. Then, to apply any style, click on the preview thumbnail of the chart style you want. This applies the Chart Style to your selected chart, as shown in Figure 4.
  9. Chart Style applied in PowerPoint
    Figure 4: Chart Style applied in PowerPoint
  10. More Charts, Same Look?

  11. The process explained on this page applies the Chart Style only to the selected chart. If you more than one chart in your presentation, you will have to repeat this process for each chart.
  12. Save your presentation.

See Also:

Chart Basics: Chart Styles (Glossary Page)

Chart Styles in PowerPoint 2016 for Windows
Chart Styles in PowerPoint 2011 for Mac
Chart Styles in PowerPoint 2010 for Windows
Chart Styles in PowerPoint 2007 for Windows

You May Also Like: Take Lessons From Digital UX to Improve Your Public Speaking | Zimbabwe Flags and Maps PowerPoint Templates


Popular Posts

Create Animated GIFs from PowerPoint Slides
Explore ways to create animated GIFs from PowerPoint slides.

PowerPoint Tutorials
These PowerPoint tutorials have many screen shots that show you exactly what you see in your computer!

Use Safe Fonts Available on All Systems in PowerPoint
Learn about using safe fonts in PowerPoint.

10 Tips for Pecha Kucha
Read 10 amazing Pecha Kucha tips that will help you create and deliver a better Pecha Kucha presentation.


Jigsaw Graphics for PowerPoint

Here are 10 jigsaw graphics containing different shapes. These graphics are available in both black and white and are contained within separate sample presentations that you download. Additionally, these jigsaw graphics are vector shapes, so you can easily edit them within your Microsoft Office program by changing fills, lines, and effects or even applying Shape Styles.

Download and use these Jigsaw Graphics in your slides for just $4.99+

This is the original page. An AMP (Accelerated Mobile Page) version of this page is also available for those on mobile platforms, at Chart Styles in PowerPoint 2013 for Windows.


Microsoft and the Office logo are trademarks or registered trademarks of Microsoft Corporation in the United States and/or other countries.

Home | PowerPoint | Photoshop | PowerPoint Templates | PowerPoint Tutorials | Blog | Notes | Ezine | Media Kit | Feedback | Site Map | About Us | Contact Us

Link to Us | Privacy | Testimonials

PowerPoint Backgrounds | Christian PowerPoint Backgrounds | Business PowerPoint Presentation Templates

Plagiarism will be detected by Copyscape

©2000-2023, Geetesh Bajaj. All rights reserved.