Apply predefined Chart Styles to your charts in PowerPoint 2007 for Windows. With one click, predefined combinations of various chart elements can be easily applied.
Author: Geetesh Bajaj
Product/Version: PowerPoint 2007 for Windows
OS: Microsoft Windows XP and higher
Long time PowerPoint users will remember the difficulties of charting. It was so painful, time-consuming, and repetitive a task changing the fills of all the series one after the other. Moreover, if your presentation had more than one chart slide, then you also had to ensure that all charts looked the same.
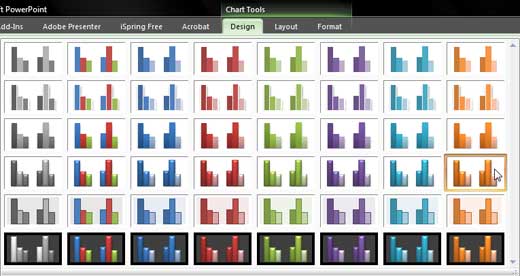
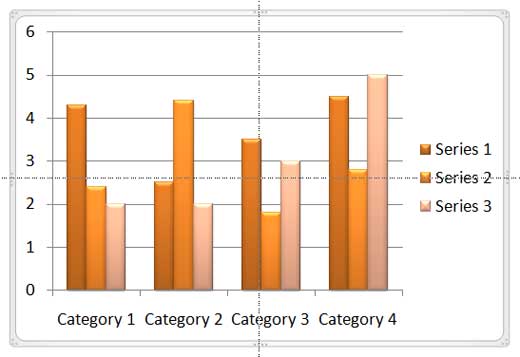
PowerPoint 2007 makes this sort of repetitive formatting easy and consistent with the Chart Styles option. These are predefined styles that contain combinations of formatting elements such as fills, outlines, and effects. PowerPoint provides various styles to choose from, and all these styles are based on Office Themes.
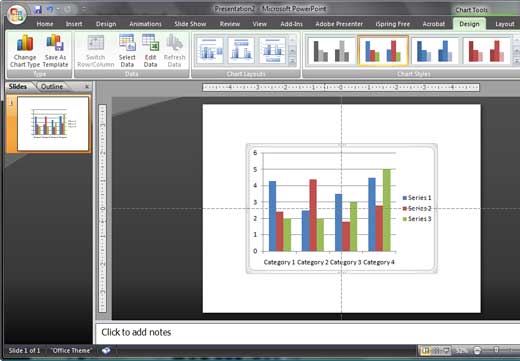
To apply a Chart Style, you first need to have a chart in your presentation. Learn how to insert a chart in PowerPoint 2007, and then follow these steps to apply a chart styles in PowerPoint 2007 (or even PowerPoint 2010):


See Also:
Chart Basics: Chart Styles (Glossary Page)
Chart Styles in PowerPoint 2016 for Windows
Chart Styles in PowerPoint 2013 for Windows
Chart Styles in PowerPoint 2011 for Mac
Chart Styles in PowerPoint 2010 for Windows
You May Also Like: Differences in PowerPoint Usage in Microsoft Teams and Zoom: Conversation with Dave Paradi | Scandinavia PowerPoint Templates


Microsoft and the Office logo are trademarks or registered trademarks of Microsoft Corporation in the United States and/or other countries.