Read an exclusive book excerpt from Special Edition Using Microsoft Office PowerPoint 2003.
Author: Patrice-Anne Rutledge and Jim Grey
Product/Version: PowerPoint
Troubleshooting
Design Corner: Using Chart Formatting Options
I can't find the menus or toolbar buttons you mention.
Be sure that Microsoft Graph is active if the text mentions that this menu or toolbar button is part of that application. If you're in PowerPoint, the Graph options aren't on the screen. To activate Microsoft Graph, double-click your chart.
My datasheet numbers display in exponential formatting.
You need to apply a formatting category other than the default General formatting if your numbers exceed 11 digits. To do so, choose Format, Number from within Microsoft Graph and change to a category such as Number or Currency.
I can't see the Add Trendline option from the Chart menu.
You can only create a trendline with unstacked area, bar, column, line, stock, XY (scatter), and bubble charts that don't have a 3D effect. To make this menu option available, change your chart to one of these types.
My chart has empty spaces where there should be a data series.
If you don't need one of the existing datasheet rows or columns, you need to remove it entirely from the datasheet, not just the contents. Otherwise, it can display as an empty space on your chart and disrupt formatting. If a series you entered is missing, verify that none of your columns or rows is hidden. To include a hidden row/column, choose Data, Include Row/Col from within Microsoft Graph.
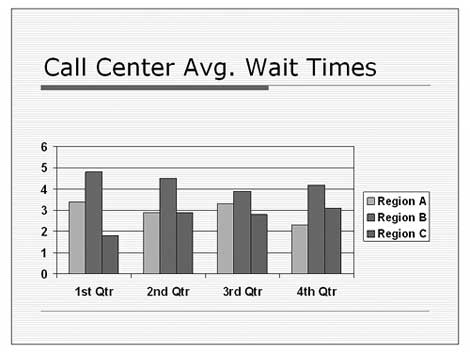
PowerPoint, in combination with Microsoft Graph, offers numerous chart-formatting options to help you create visually appealing charts. This example shows how even minor changes can enhance your chart.
For example, you could create a basic column chart by choosing the Title and Chart layout from the Slide Layout task pane (see the "Before"figure). To liven up the chart (see the "After" figure), follow these steps using the techniques you learned in this chapter:
In only a couple of minutes, you enlivened your chart and made its format better suit your needs.

Figure 11.30

Figure 11.31
See Also:
Working with Charts - 3 of 4
Working with Charts - 2 of 4
Working with Charts - 1 of 4
You May Also Like: Nuts & Bolts Speed Training: Conversation with Taylor Croonquist and Camille Holden | Bangladesh Flags and Maps PowerPoint Templates


Microsoft and the Office logo are trademarks or registered trademarks of Microsoft Corporation in the United States and/or other countries.