Read an exclusive book excerpt from Special Edition Using Microsoft Office PowerPoint 2003.
Author: Patrice-Anne Rutledge and Jim Grey
Product/Version: PowerPoint
Selecting a Chart Type
Entering Data in the Datasheet
PowerPoint offers plenty of chart types and sub-types for almost every kind of graphic representation you could want to create. Sub-types are variations on a basic chart type, such as 3D options. PowerPoint includes these basic chart types:
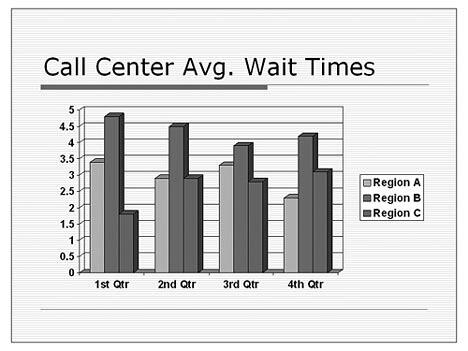
Figure 11.7:
A column chart makes it easy to compare series of data.
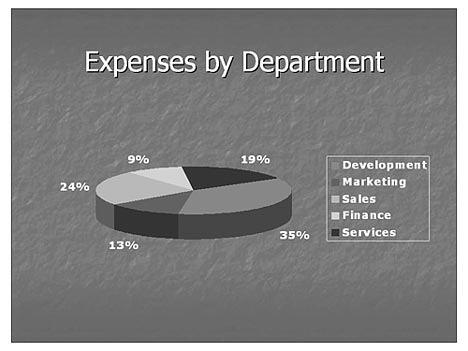
Figure 11.8: Use pie charts to show percentages of a total amount.
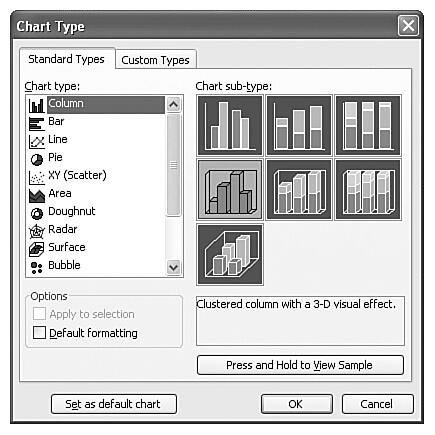
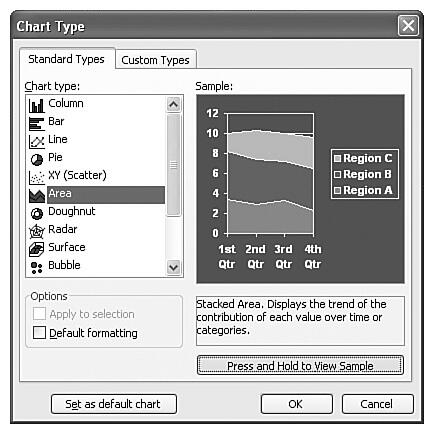
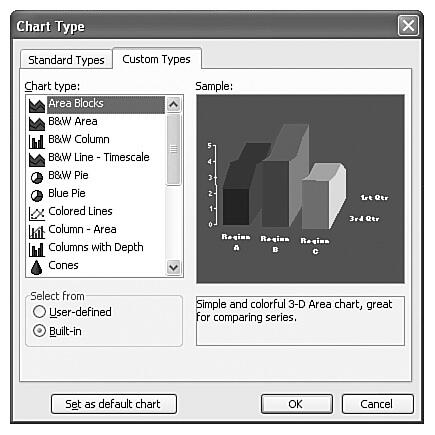
If you already know that you want to create a 3D clustered column chart, which is the PowerPoint default, you don't need to do anything to select a chart type. However, if you want to use a different chart type, you should select it before you enter any data or make any other modifications. There are two ways to change the chart type in PowerPoint. You can click the down arrow next to the Chart Type button on the Standard toolbar and select the chart type you want to apply from the palette that appears. Place the mouse over a specific chart type to view a chart tip that tells you the chart type's name. PowerPoint applies the chart type to your chart, which reformats itself in the new type. Not all chart types are available through the Chart Type button, however. If you can't find what you need on the palette that appears, try the Chart Type dialog box (Chart, Chart Type).
In either case, if you don't like the new chart type you applied, click the Undo button on the Standard toolbar to return to your original selection.
To apply a new chart type using the Chart Type dialog box, follow these steps:
The default datasheet that opens when you first create a chart includes four columns and three rows. This is a common chart format—comparing specific categories over periods of time—but only one of the hundreds of possible formats. Figure 11.12 illustrates this datasheet.

Figure 11.12:
Enter chart data in a datasheet, similar to an Excel worksheet.
The first row and column of a datasheet serve as headers for the information in the datasheet. Therefore, the second row begins with the number 1 and the second column with the letter A. In this example, the columns display as the category axis, the rows display as the data series listed in the legend, and the cell data (A1:D3) represents the value axis.
To input your own data, just type over the existing information in each cell.
If the data you need is already in an Excel spreadsheet, you can import directly from Excel without re-entering this information in the datasheet. Click the Import File button on the Standard toolbar to open the Import File dialog box. Choose the Excel file you want to import and click Open. The Import Data Options dialog box guides you through this process. Note that you can import from Lotus 1-2-3 and text file formats as well.
To delete a row or column, place the cursor within the appropriate row or column and choose Edit, Delete from the menu. To remove the contents of a cell rather than the cell itself, choose Edit, Clear, Contents. Clearing the contents is best when you want to remove existing data and replace it with new data. If you no longer need the row or column, you should delete it. You can delete a row or column by selecting its heading and pressing the Delete key.
To insert a new row, select the row below where you want to place the new row and choose Insert, Cells. Microsoft Graph inserts a new row directly above the selected row.
To insert a new column, select the column heading to the right of where you want to place the new column and choose Insert, Cells. Microsoft Graph inserts a new column directly to the left of the selected column.
If you want to insert a new cell, rather than a complete row or column, select the cell where you want to insert a cell; choose Insert, Cells; and choose either Shift Cells Right or Shift Cells Down in the Insert dialog box (see Figure 11.13).
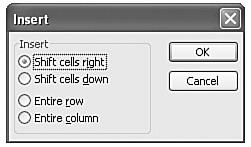
Figure 11.13: Determine the direction to move the existing cells in the Insert dialog box.
PowerPoint inserts a new cell and shifts the row to the right or shifts the column down, depending on your selection. You can undo insertions and deletions by clicking the Undo button or pressing Ctrl+Z.
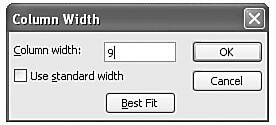
To format the datasheet's column width, follow these steps:
You can format the text and numbers in your datasheet if you want. To format numerical data, select the cell or cells you want to format and choose Format, Number. The Format Number dialog box appears, as shown in Figure 11.15.
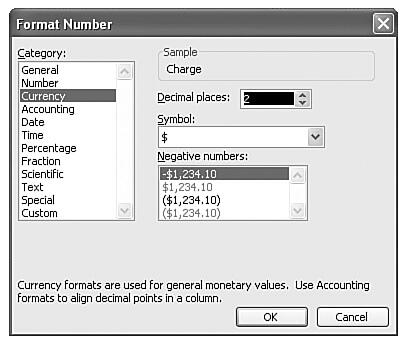
Figure 11.15:
Customize the way numbers appear in this dialog box.
Select the type of number format you want from the Category list, such as date, time, or currency format. Based on your category selection, the right side of the dialog box offers additional formatting options related to the category.
For example, if you choose Currency, the right side of the dialog box lets you choose the currency symbol such as the dollar, pound, or yen. Several of the numeric categories also let you choose the number of decimal places you want to include.
Click OK to accept the formatting changes and to update your chart.
You can include rows and columns in your datasheet, but temporarily hide them in your presentation. To do that, select the column or row that you want to hide, and choose Data, Exclude Row/Col. The row or column appears shaded in your datasheet and temporarily disappears from your presentation. Figure 11.16 shows an example of a hidden column in a datasheet.
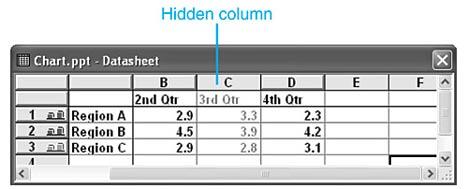
Figure 11.16:
This hidden column will temporarily be removed from the chart.
To include this information again, choose Data, Include Row/Col.
When you finish formatting and modifying the datasheet, you can close it by clicking the View Datasheet button on the Standard toolbar. Or you can return to working on the presentation while the datasheet remains open by clicking on any section of the presentation.
To reopen the datasheet, click the View Datasheet button again.
See Also:
Working with Charts - 4 of 4
Working with Charts - 3 of 4
Working with Charts - 1 of 4
You May Also Like: Hypersay with Live Subtitles: Conversation with Brian Daly | Bahamas Flags and Maps PowerPoint Templates


Microsoft and the Office logo are trademarks or registered trademarks of Microsoft Corporation in the United States and/or other countries.