Gantt charts are among the most useful visualizations you can use to show a process with concurrent tasks. Such tasks are not easy or even practical to create within PowerPoint, and we did explore a proof of concept tutorial. Now, let us explore how think-cell, a well-known PowerPoint add-in can make this task simpler. With think-cell, it’s also easier to update Gantt charts as needed.
Gantt Charts using think-cell
Guidelines for Creating Better Gantt Charts in think-cell
Beyond think-cell
Gantt Charts using think-cell
Please follow these steps to get started creating a Gantt chart within PowerPoint using the think-cell add-in:
- First, confirm that think-cell is installed on your system. Do you know that a free 30-day trial version can be downloaded from the think-cell website? Once think-cell is installed, open PowerPoint. Add a new slide and access the Insert tab of the Ribbon, where you will find the think-cell group. Click on the Elements button, shown highlighted in red within Figure 1, below.

Figure 1: think-cells' Elements button- This action brings up a drop-down menu, as shown in Figure 2, below.
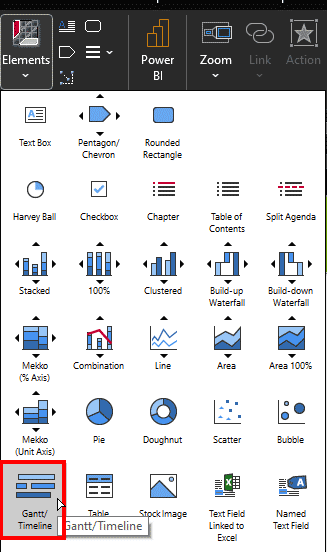
Figure 2: Choose to create a Gantt chart- You will see a yellow bounding box. Click anywhere on the slide to insert a new Gantt chart, as shown in Figure 3, below.
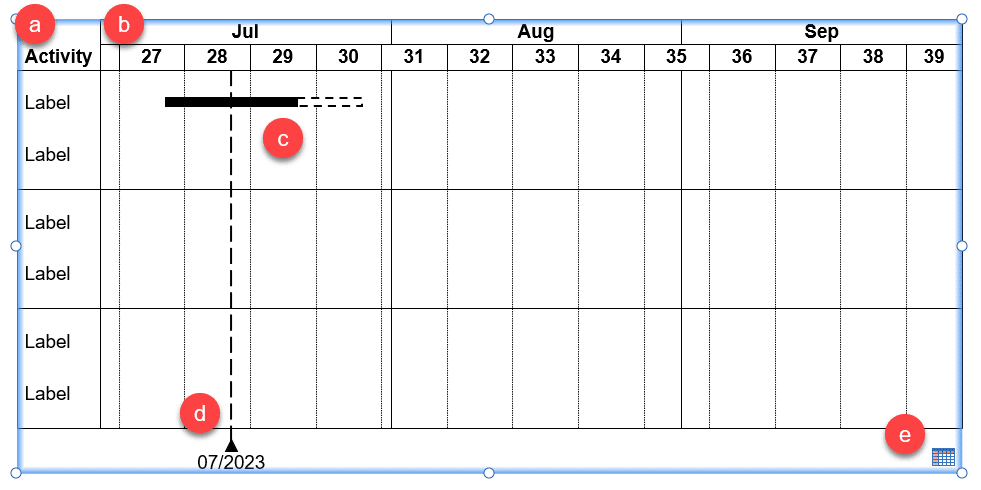
Figure 3: Instance of a Gantt chart- Let us take stock of what we have here to begin with, as marked in Figure 3, above:
- The Activity pane on the left contains a list of tasks.
- A timeline is placed atop the Gantt chart, as a ruler with dates.
- A sample Gantt bar is added. In fact, two bars are added. The leftmost one has a solid fill, and the rightmost one is dashed in appearance.
- A milestone is added.
- You can click on the Datasheet icon on the bottom right to open an instance of Excel to add data for this Gantt chart.
- Let’s now add our own data to this Gantt chart. To do so, begin by double-clicking any area in the timeline to bring up the Calendar dialog box, shown in Figure 4, below.

Figure 4: Calendar dialog box- Note that you can see the time span used in the timeline within the Calendar dialog box, as shown highlighted in blue within Figure 4, above. Also, notice the selection handles on both ends of this time span, as shown highlighted in red within Figure 4. You can alter the time span as needed by dragging these handles. Also note that think-cell thoughtfully lists week numbers, as shown highlighted in green within Figure 4. Any change you make within this dialog box is simultaneously reflected within the timeline in the Gantt chart.
- There’s so much more you can do. For example, you can show all days of the week or leave out the weekends. More information on working with the Calendar dialog box and other aspects of the Gantt chart can be found on the How to create a Gantt chart in PowerPoint page on think-cell’s site.
- Next, you can work with the task names shown on the Activity column, marked in Figure 3, shown earlier on this page. You will notice that the default Gantt chart has three groups of two tasks each. Tasks are often placed within groups to create a logical understanding. Here’s what you can do with these tasks:
- Rename the existing tasks: By default, the tasks are named Label. You can select any task and type to overwrite existing task names.
- Add new tasks: Right-click any existing task to bring up the think-cell contextual menu, as shown in Figure 5, below. Then, click on the Insert Row option, highlighted in green within Figure 5. You can also use the Ctrl + Alt + Down Arrow keyboard shortcut.
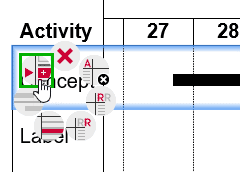
Figure 5: Add a new row- Delete existing row: To delete an existing task and the associated row, right-click the task you want to remove. In the think-cell contextual menu, as shown in Figure 6, below, click on the Delete option, highlighted in green within Figure 6. You can also use the Delete keyboard shortcut.
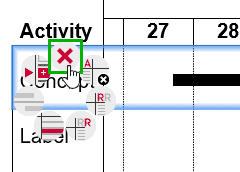
Figure 6: Delete task and row- Move tasks: You can easily move tasks by selecting, and then dragging the task to a new location.
- Group tasks: To group (or separate) a few tasks, select and right-click the first task outside (below) the new group you want to create. Then, right-click to bring up the think-cell contextual menu, as shown in Figure 7, below. Then, click on the Add row separator option, highlighted in green within Figure 7.
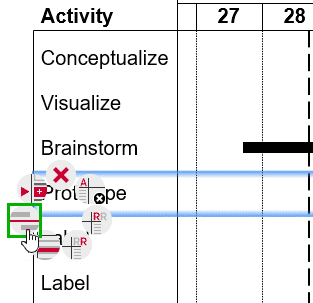
Figure 7: Add row separator- Doing so will add a separator above the task creating a group of all tasks between two separators, as shown in Figure 8, below.
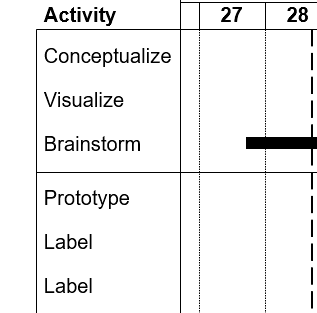
Figure 8: Separator added- Remove separator: If you no longer want to group some tasks, or if you need to make a larger group by removing a separator, then just select only the separator, and click the Delete key.
- Now, let us explore the tasks themselves, and these are represented by the Gantt bars. As you may have noticed, there are two types of bars: solid and dashed. We will now show you how to add bars and how to change them from solid to dashed and the other way around.
- There are two ways to add a new Gantt bar:
- You can right-click within an empty area to bring up the contextual think-cell menu, as shown in Figure 9, below. Now, click the New bar button, highlighted in green within Figure 9.
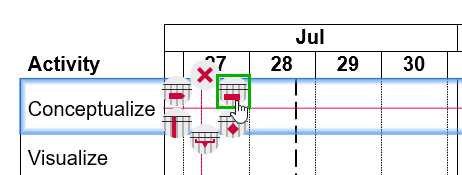
Figure 9: Add new bar- Doing so places a new bar, as shown in Figure 10, below. You can select and drag the bar leftwards or rightwards, or even to another row altogether.

Figure 10: New bar added- Another way to add a new bar is to select an existing bar, and then press the Ctrl key. Now, when you drag the bar, your original bar will not be disturbed, and a copy will be placed where you drag it to.
- Once you have added bars, you can resize them. Select the bar so that you can see resizing handles on each side of the bar, as shown highlighted in red within Figure 11, below.

Figure 11: Selection handles for a bar- Now, drag the handles leftwards or rightwards to resize the bar. If you need accurate resizing, double-click the bar to bring up the Calendar dialog box that we have already explored, as shown in Figure 4, previously on this page. You can alter the beginning and end time for the bar within this dialog box.
- Do note that bars can only be made narrower or wider. They cannot be made thinner or thicker.
- By default, think-cell inserts a bar with a solid fill. To make your Gantt bar dashed, click on the bar so that a floating toolbar is visible, as shown in Figure 12, below. Now, click on the Arrow button within the top option in this toolbar, as shown highlighted in red within Figure 12. Within the dropdown menu that appears, choose the Dashed Bar option.

Figure 12: Change to a dashed bar- To change from a dashed bar to a solid bar, just reverse these steps. To learn more about other changes you can make with rows, such as adding row labels, explore our How to create a Gantt chart in PowerPoint page.
- Let’s now work with milestones. So, what is a milestone? In Gantt charts, milestones represent significant events in due course of a project’s timeline. Since milestones signify achieving a goal, they need to be used only for the completion of critical goals or for a major event.
- To add a milestone, right-click on an empty area or even an area below the Gantt chart. Then, click the New Milestone option in the resultant think-cell menu, as shown highlighted in green within Figure 13, below.
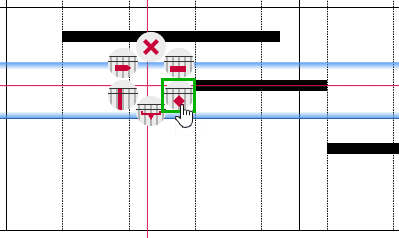
Figure 13: Add new milestone- To add a line to this milestone, right-click the milestone and click the Add milestone line option, as shown highlighted in green within Figure 14, below.
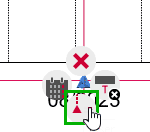
Figure 14: Add milestone line
Back
Guidelines for Creating Better Gantt Charts in think-cell
Let us now explore some guidelines so that you can create even better Gantt charts using the think-cell add-in for PowerPoint:
1. Automatic adjustments
Since think-cell is made from the ground up to function in a completely responsive way, you can resize your Gantt chart smaller or larger as often as you need, and the layout engine will almost miraculously reorient all elements within your Gantt chart without losing a single element.
2. Efficient timelines
You can create a Gantt chart that only shows weekdays. This means that the weekends will not be shown. You can even decide which days are the weekends, depending on the country that the Gantt chart is being created for. For example, in the United States, weekends are Saturday and Sunday. However, in some countries, weekends are Friday and Saturday.
3. Anchor interdependent tasks
Gantt bars can be connected to each other so that one bar starts when the other one ends. This is called anchoring. For example, let's say you have a Gantt chart with two tasks: Task 1 and Task 2. Task 1 needs to be finished before Task 2 can start. think-cell allows you to anchor Task 2 to the end of Task 1. What does this mean? It means that if you extend the duration of Task 1, or if it is delayed, then the start of Task 2 will also be delayed.
4. Responsibilities and Remarks
think-cell allows you to add extra columns for both responsibilities and remarks. The former column specifies the person or team responsible for a task, and the second column lets you add useful comments or even ideograms such as Harvey balls or check-boxes.
Back
Beyond think-cell
While think-cell is the most balanced option between ease of use and power for creating Gantt charts and many other chart types, there are some aspects that you must be aware of.
Although we may have covered just the tip of the iceberg as far as Gantt charts in think-cell are concerned, keep in mind that think-cell’s role is not to create in-depth Gantt charts with all features possible. Instead, think-cell’s role is to translate them into PowerPoint for a more simple, high-level look that people can present to stakeholders.
There are other Gantt chart tools out there for in-depth Gantt chart management, such as Monday, Asana, Wrike, etc.
Back


