Patterns in PowerPoint are two-color designs comprising lines, dots, dashes and checks. PowerPoint includes 48 such patterns with names like Plaid, Weaves, Shingle, and Zig Zag (see them later on this page in Figure 2). When used with some caution, patterns can make a great fill for your Plot Area, almost like any other fill. In this tutorial, let us learn how to apply a pattern fill to the chart's Plot Area in PowerPoint 2013 for Windows.
Follow these steps to explore more in PowerPoint 2013 for Windows:
- Select the chart that you want to format the Plot Area for. If you don't have an existing chart, insert a new chart in your slide.
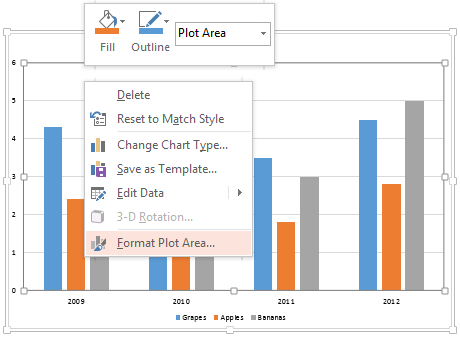
- Now, carefully right-click the Plot Area to bring up a contextual menu as shown in Figure 1. In this contextual menu, select the Format Plot Area option (refer to Figure 1 again). If you do not get the Format Plot Area option in the contextual menu, you may have right-clicked on another chart element. Make sure you then deselect anything in the chart, and then right-click on the edge of the Plot Area.

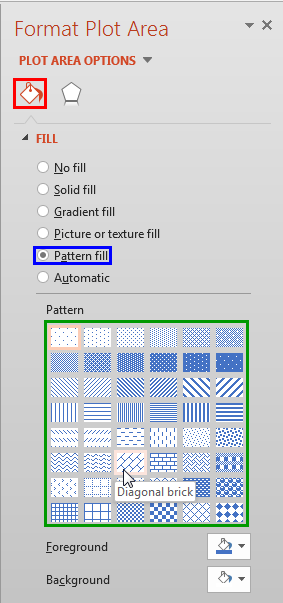
Figure 1: Format Plot Area option - This action opens the Format Plot Area Task Pane, as shown in Figure 2. In this Task Pane, click the Fill & Line button, highlighted in red within Figure 2 and click the Pattern fill radio button (highlighted in blue within Figure 2).

Figure 2: Pattern fill option selected - You can see the Pattern gallery on the lower half of the Format Plot Area Task Pane, shown highlighted in green within in Figure 2, above.
- Choose any of the pattern styles. Figure 2 above shows that we selected a pattern named Diagonal brick. You can select any pattern all the way from 5% to Solid diamonds.
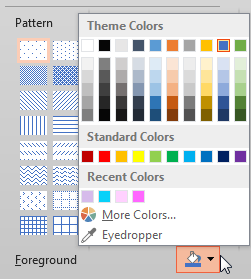
- Whichever pattern you choose, you can then change the Foreground and Background colors for the pattern using the Foreground and Background color buttons that you can see in Figure 2, above (below the area highlighted in green). When you click any of these buttons you can see the Colors drop-down gallery as shown in Figure 3.

Figure 3: Colors drop-down gallery - This drop-down gallery will work in the same way as it does for solid fills. If you don't want to change the Foreground and Background colors, or any one of them, just accept the default color values that PowerPoint uses.
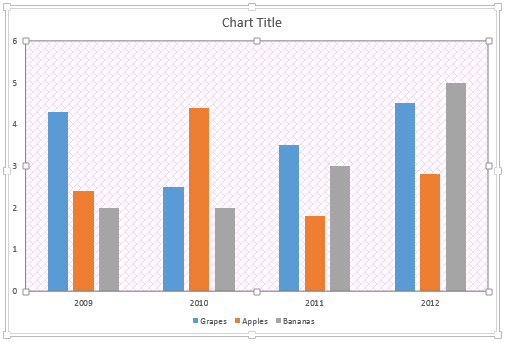
- Select the required pattern style and format the Plot Area as required. In Figure 4, you can see that the Plot Area of our sample chart is filled with the selected pattern style (compare with the partially visible chart in Figure 1, shown earlier on this page).

Figure 4: Plot Area applied with a pattern fill - Save your presentation often.


