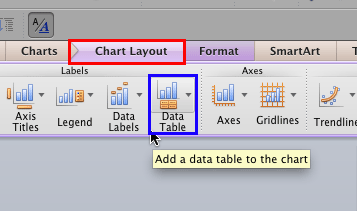
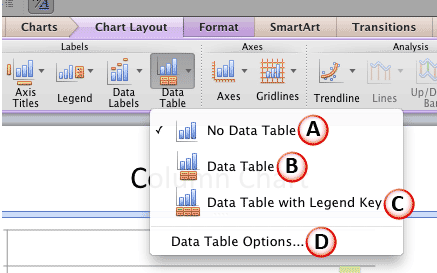
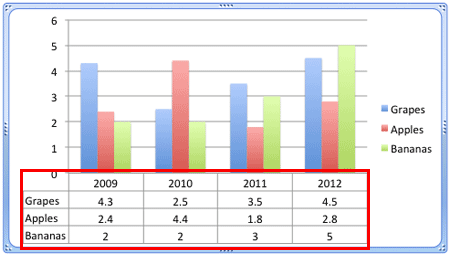
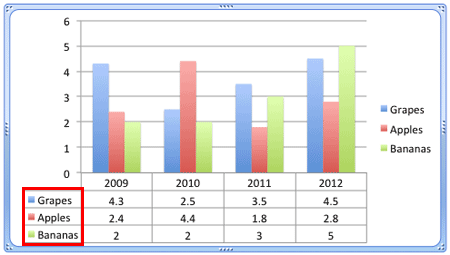
Learn about the Data Table for charts in PowerPoint 2011 for Mac. The Data Table can be placed adjacent to the chart.
Author: Geetesh Bajaj
Product/Version: PowerPoint 2011 for Mac
OS: Mac OS X
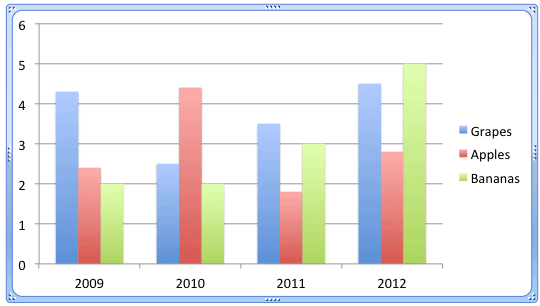
Copy a bunch of Excel cells into PowerPoint or even create a table within PowerPoint itself and type in some data. This is something that can be difficult for most audiences to comprehend because figures don't show any trends, at least no visual trends. The solution typically is to add a chart on your slide that's based on the same data so that you can compare two or more sets of values more visually and intuitively. However, there may be times when you need to show both the chart and the underlying data. To make this possible, you can use PowerPoint's Data Table option This way, not only you get the pictorial representation of the values, but also get to show the same values in the form of a table right below the chart.
Follow these steps to learn more in PowerPoint 2011 for Mac:
See Also:
Chart Data: Chart Data Table (Glossary Page)
Chart Data Table in PowerPoint 2013 for Windows
You May Also Like: Presenting Data Effectively: Conversation with Dr. Stephanie Evergreen | Happiness PowerPoint Templates


Microsoft and the Office logo are trademarks or registered trademarks of Microsoft Corporation in the United States and/or other countries.