The Chart Area is essentially covered by the entire chart and is populated with various other chart elements. For all practical reasons, you can say that the entire chart is contained within the Chart Area. When you insert a chart, the position of Chart Area on the slide depends upon the layout of the slide containing the chart. If your slide layout is Blank, then the Chart Area is located within the center of the slide. If the chart is inserted within an existing placeholder on the slide, it occupies the entire placeholder. To change the position of the Chart Area, you can either just select and drag it to the new position on the slide, or reposition it accurately as explained in this tutorial. This tutorial will also teach you how to add alternative text to the chart to help people with visual disabilities.
Follow these steps to explore more in PowerPoint 2011 for Mac:
- Select the chart that you want to format the Chart Area for. If you don't have an existing chart, insert a new chart.
- Now, select either the Chart Layout or the Format tab of the Ribbon. Both of these tabs contain the Current Selection group that you can see in Figure 1 towards the extreme left. Within this group, you can see the Chart Elements selection box (highlighted in red within Figure 1). This selection box contains a list of chart elements in the selected chart. Within this list, click on the Chart Area option. Now, you can see a tick mark prefixed to this option, as shown in Figure 1 to indicate its selected status.
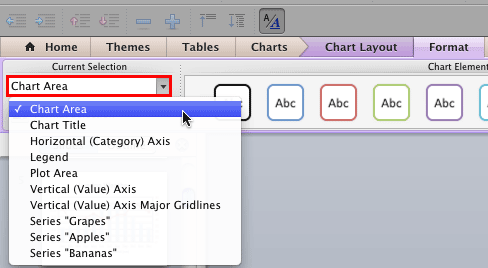
Figure 1: Chart Area selected Note: The
Chart Layout and
Format tabs are
contextual tabs. These tabs are special tabs in the
Ribbon that are not visible all the time. They only make an appearance when you are working with a particular slide object which can be edited using special options.
- Below this Current Selection list is the Format Selection button, as shown highlighted in red within Figure 2. Click this button.
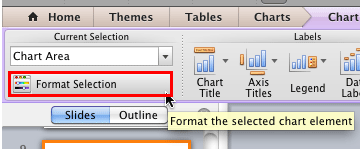
Figure 2: Format Selection button - Alternatively, carefully right-click (or Ctrl+click) the Chart Area (click close to the edge of your chart). From the contextual menu that appears, select the Format Chart Area option as shown in Figure 3.
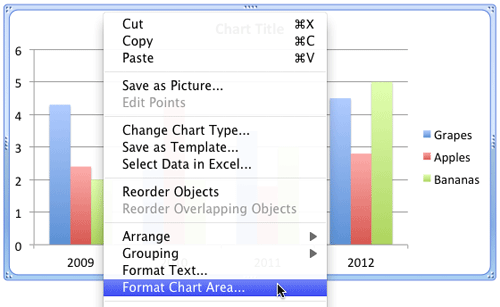
Figure 3: Format Chart Area option - Doing so summons the Format Chart Area dialog box as shown in Figure 4.
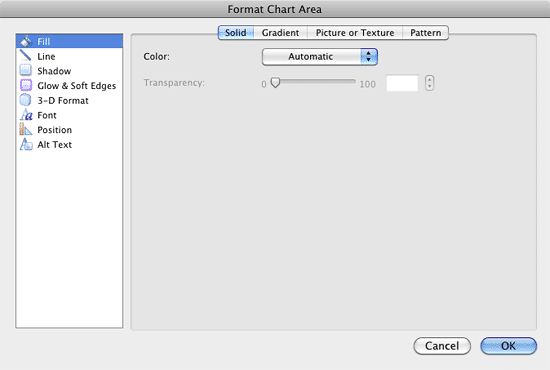
Figure 4: Format Chart Area dialog box - In this dialog box, you can see various options (within the sidebar) that help you to format the Chart Area.
- Now, let us explore the last two options: Position and Alt Text:
- Position: This option helps you to reposition your chart on the slide accurately. Click this option within the sidebar of the Format Chart Area dialog box to access the options that you see in Figure 5.
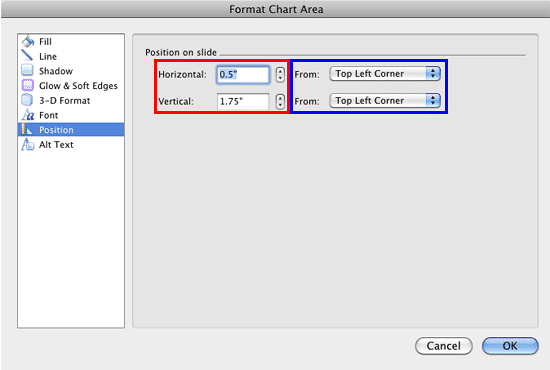
Figure 5: Position options within the Format Chart Area dialog box - The Horizontal and Vertical options within Format Chart Area dialog box (highlighted in red within Figure 5) let you alter the corresponding horizontal and vertical positions of the selected Chart Area (chart).
- Horizontal: Type in a numeric value or use the increase/decrease buttons to change the horizontal positioning of a Chart Area.
- Vertical: Type in a numeric value or use the increase/decrease buttons to change the vertical positioning of a Chart Area.
- The zero point for a Chart Area is always calculated from either of two anchor points within the slide, as shown in the drop-down list for both the From options (highlighted in blue within Figure 5, above). Each of these drop-down lists have two similar options, as shown in Figure 6.

Figure 6: Options within the From drop-down list to decide the anchor point for the Chart Area - If you make no choices, then by default all values are calculated from the Top Left Corner of the slide but you can also choose to position from the Center of the slide, which you can see in Figure 6 as the second option within the From drop-down list.
- Alt Text option is used to enter the alternative text for your chart. Alt Text helps the people who visual accessibility issues. Select this option within the Sidebar of the Format Chart Area dialog box to access the options that you see in Figure 7.

Figure 7: Alt Text option within the Format Chart Area dialog box - Add a suitable Title and Description to the chart and click the OK button to apply the changes.
- Select the required option and format the Chart Area as required.
- Save your presentation often.


