Read the Indezine review of CrystalGraphics Chart and Diagram Slides for PowerPoint.
Author: Geetesh Bajaj
Product/Version: PowerPoint
Introduction
Using Chart and Diagram Slides for PowerPoint
Pricing and Support
Conclusion
There are so many ways in which you can create a better chart or a diagram using nothing apart from the tools available in PowerPoint -- yet playing with all these options does take a fair amount of time. If you want something quick, and also want the graphic content of your slides to shine through, then you may want to explore our review product: CrystalGraphics Chart and Diagram Slides for PowerPoint. Charts and Diagram Slides for PowerPoint is from CrystalGraphics, a well-known vendor of PowerPoint add-ins for more than a decade. This add-in comprises over 1000 data-driven charts and editable diagrams. All the content is available as slides that you insert into your existing presentations. While the entire content is available as PowerPoint slides (in the PPTX format), the best way to use these is via a custom add-in that plugs into PowerPoint.
You can learn more about the Chart and Diagram Slides for PowerPoint from their site. My contact at CrystalGraphics for this review was Jasmine Ricks -- thank you, Jasmine.
BackPresently, the entire Chart and Diagram Slides for PowerPoint collection is available in 10 volumes of 100 slides each. You can buy any individual
volume, or the entire 10 volumes as part of a combo collection. You are provided a download link once you buy one or more volumes. Once you download
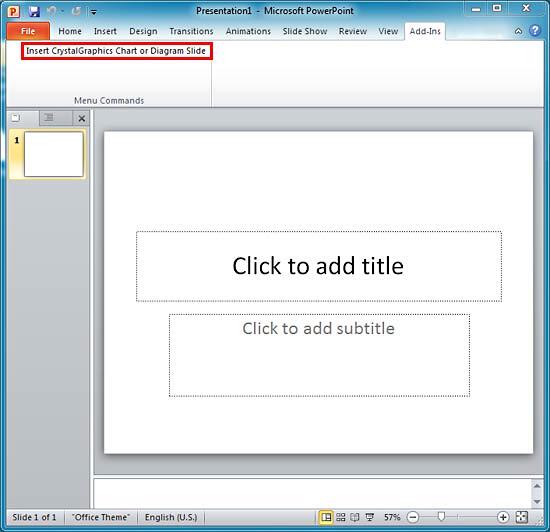
the files, you need to install. Once installed, you see the new Menu Commands group within the Add-Ins tab on the
Ribbon, as shown highlighted in
red within
Figure 1. Although this tutorial is done in PowerPoint 2010, Chart and
Diagram Slides for PowerPoint also works within PowerPoint 2007.

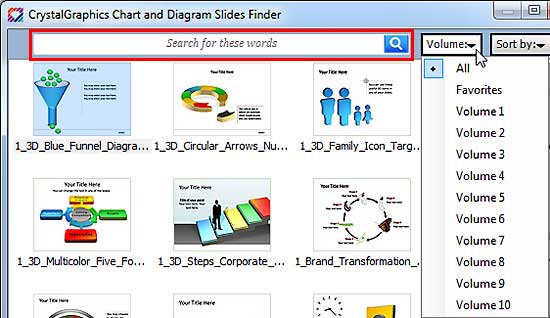
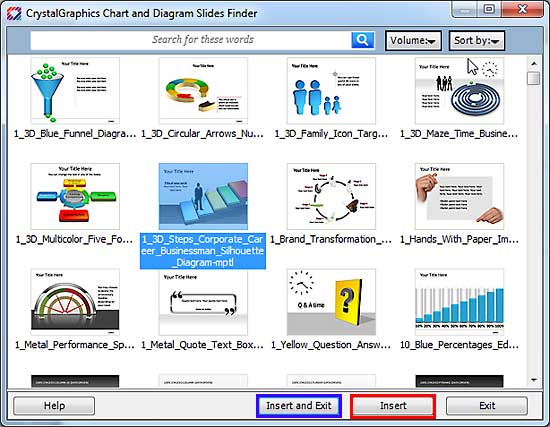
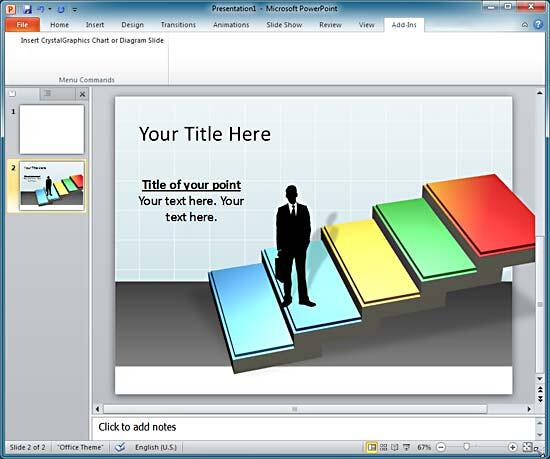
Follow these steps for a small walkthrough that shows how you can use Chart and Diagram Slides for PowerPoint:


CrystalGraphics Chart and Diagram Slides for PowerPoint is available as 10 individual volumes -- at the time of writing, 10 volumes were available for US$49.00 each. You can also get a 10 volume combo that includes the entire collection for US$249.00 -- that's a saving of almost 50%.
Support is through e-mail, telephone, and online FAQ.
BackCrystalGraphics Chart and Diagram Slides for PowerPoint is easy to use and slides from this collection can be used into any PowerPoint presentation. The collection of charts and diagrams are creatively-designed and some of them are also animated. All the content uses native PowerPoint shapes and SmartArt graphics -- making easy for you to edit them as required. You can also change any data for a chart.
However, not all the content is theme aware -- so do not expect the graphic to always coordinate with the colors used in your existing presentations. The folks at CrystalGraphics added: "Since themes and templates can modify the color schemes of some of the diagrams in such a way that they don’t look very good (and white goes with everything) we decided to default to not changing the slide to match the theme. But, if you want it to match your theme, all you have to do is select the slide and click on the theme or template you want, and it will change accordingly."
The cost is reasonable too, especially if you buy the 10 volume Combo. All put together, the product is worth its price if you use even a few of the charts and the diagrams included.
BackYou May Also Like: Animals - P PowerPoint Templates | Efficient Elements


Microsoft and the Office logo are trademarks or registered trademarks of Microsoft Corporation in the United States and/or other countries.