
This is the print version of this page. All content is copyright Indezine.com 2000-2026.
Explore working with negative values within waterfall charts in PowerPoint.
Author: Taylor Croonquist
Product/Version: PowerPoint
Working with Negative Numbers
Ending Excel Spreadsheet Formulas for your Negative Waterfall Chart
Now that you know how to build a Waterfall chart with positive numbers, the question is how do you handle negative numbers? Although this requires a bit more work, it’s no problem if you keep your spreadsheet organized.
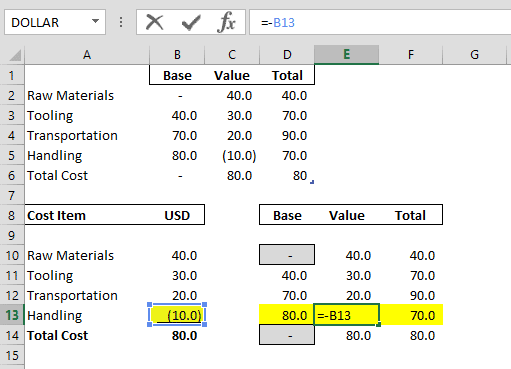
Continuing with the same example, if we change the handling fee above from a positive 10 to a negative 10 (a handling discount), the Excel spreadsheet updates to a total cost of 80 (we’ve marked the row in yellow within Figure 1), below.
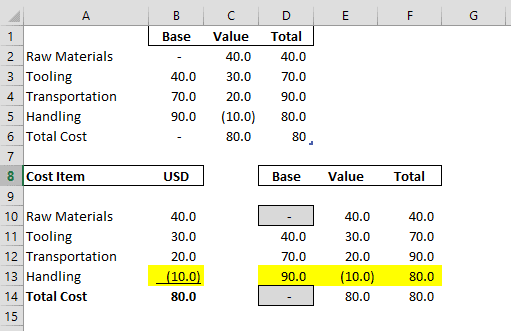
Figure 1: Excel Sheet Handling Discount of 10
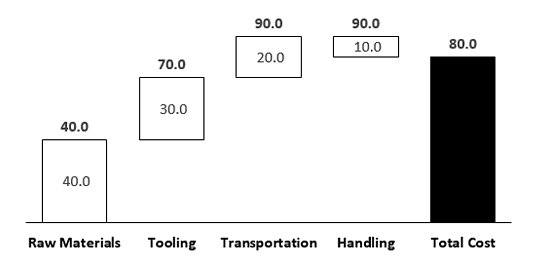
With the handling discount of 10, the Waterfall Chart in PowerPoint is no longer correct as the Handling column disappears, as shown in Figure 2, below.
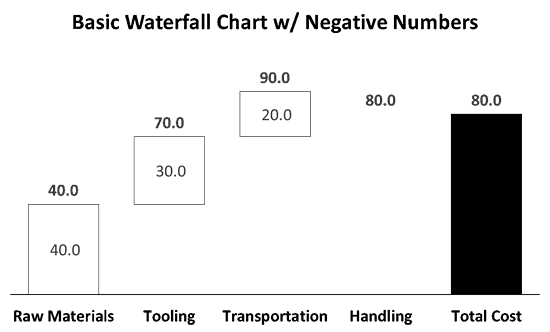
Figure 2: PowerPoint Resulting Waterfall Chart
Follow these steps to resolve this issue:
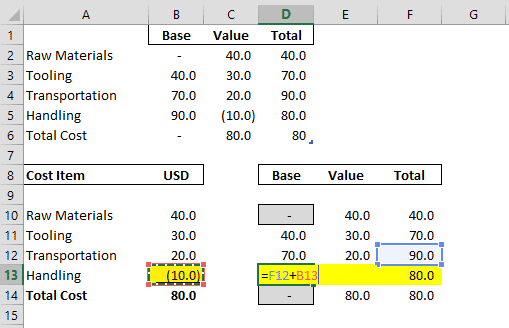
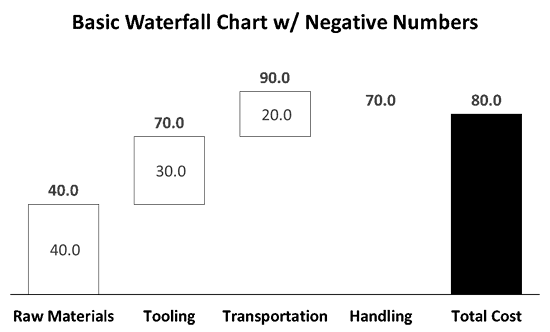
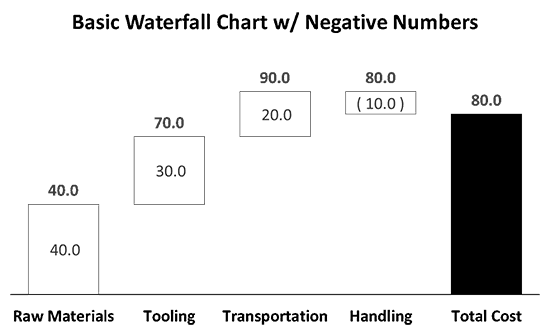
If at any point your number changes back to a positive value, you will need to go back into Excel to adjust the formulas, and then correct the data label manually back in PowerPoint.
Just as a reference, below is what the formulas inside the Excel spreadsheet should look like for your negative Waterfall Chart.
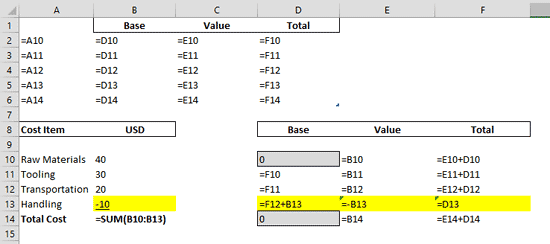
Figure 8: Formulas inside the Excel spreadsheet
Waterfall Chart Additions – Adding Step Lines, continued on Page 6 >
Create a Waterfall Chart in PowerPoint - Part 1
Create a Waterfall Chart in PowerPoint - Part 2
Create a Waterfall Chart in PowerPoint - Part 3
Create a Waterfall Chart in PowerPoint - Part 4
Create a Waterfall Chart in PowerPoint - Part 6
You May Also Like: How to Use the Zoom Transition in PowerPoint? | How to Build Digital Signage Information Screens



Microsoft and the Office logo are trademarks or registered trademarks of Microsoft Corporation in the United States and/or other countries.
