Learn about tick marks on chart axes in PowerPoint 2011 for Mac. Tick marks can be major or minor, and can show up on either side of the axes, both inside and outside.
Author: Geetesh Bajaj
Product/Version: PowerPoint 2011 for Mac
OS: Mac OS X
Charts are a visual representation of data, and when seen on a PowerPoint slide from afar, you make out the value of a series by exploring where exactly it's placed vis-à-vis the axis. Of course, if your chart has data labels, then this is less of an issue. However, typical charts such as the one shown in Figure 1, below have no data labels. For such a chart, you'll notice that the column representing Grapes in 2009 is a little taller than the value 4 in the adjacent axis, indicating a rough value of around 4.25. We're still not sure, and the Tick Marks placed on the axis will help us get a better idea.
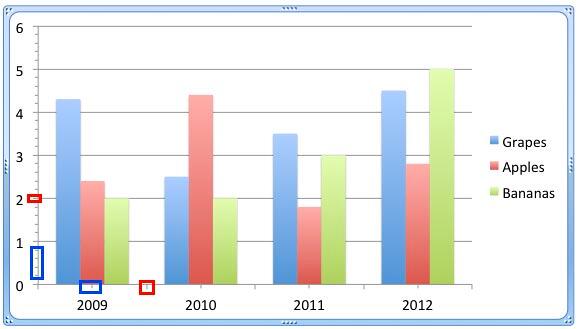
Figure 1: Major and minor tick marks on chart axes
A few tick marks have been highlighted in red and blue within Figure 1, above. We chose two colors to highlight these tick marks because most chart types show two types of tick marks on axes: major as shown highlighted in red and minor as shown highlighted in blue.
Major tick marks are indications on an axis that show up:
Both are shown highlighted in red within Figure 1, above.
Minor tick marks are those tick marks that appear between the major tick marks on an axis. Typically PowerPoint charts do not display minor tick marks, but we enabled them in the chart shown highlighted in blue within Figure 1, above. Minor tick marks help users measure the distance between the major tick marks.
If you look at this picture of a ruler (picture sourced from Office.com), you'll recollect that both major and minor tick marks have been available in all types of rulers we have used, even the rulers used in primary school.

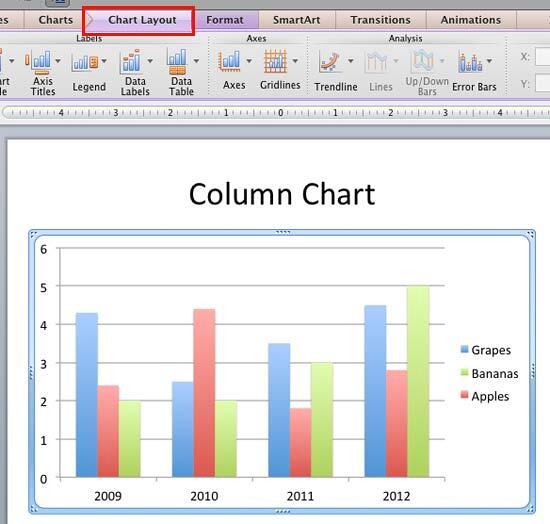
In this tutorial, we will learn how to show/hide these tick marks and also where you display these major and minor tick marks in PowerPoint 2007 for Windows:

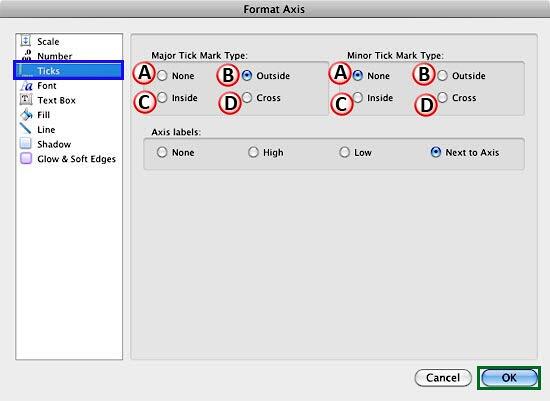
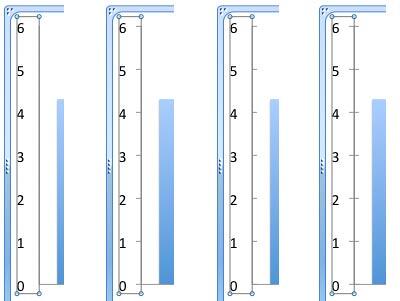
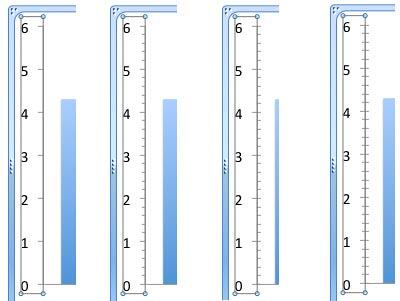
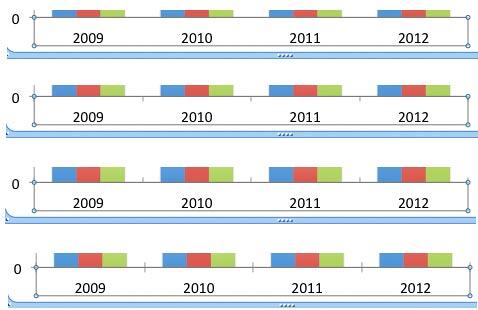
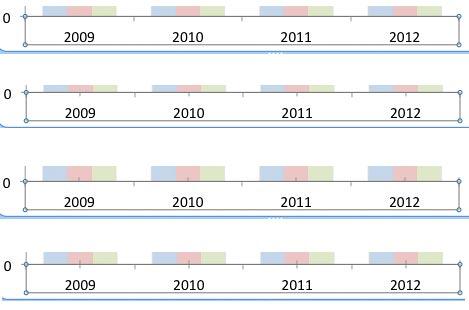
The minor tick marks and the major tick marks overlap each other at the position of major tick marks. This is so familiar to all of you because that's how the everyday common geometrical ruler works. So, if you hide major tick marks but still show minor tick marks, the minor tick marks appear at the regular major tick-mark positions too. But of course, these are not as pronounced.
10 08 04 - Chart Axes: Tick Marks (Glossary Page)
Tick Marks in PowerPoint 2013 for Windows
Tick Marks in PowerPoint 2010 for Windows
You May Also Like: Presentation Management: Why Executives are Starting to Care? | Laundry PowerPoint Templates

Microsoft and the Office logo are trademarks or registered trademarks of Microsoft Corporation in the United States and/or other countries.