Picture fills can look great and distracting at the same time. It all depends upon the type of picture you use for the fill. If you end up using a picture as a fill for your chart's Plot Area, then you must put in plenty of thought before you decide to do so. This is because you don't want to crowd your chart. So, while you can use a picture, it's best to use one that's muted or understated, and does not attract too much attention.
Plot Area Fills
Other fill types that you can apply to the Plot Area of a chart include a solid color, a gradient, a texture, or a pattern. Also, you can use a picture fill (explained on this page).
Follow these steps to learn more in PowerPoint 2011 for Mac:
- Select the chart that you want to format the Plot Area for. If you don't have a chart, insert a new chart.
- Now, carefully right-click (or Ctrl+click) the Plot Area. From the resultant menu, select the Format Plot Area option, as shown in Figure 1.
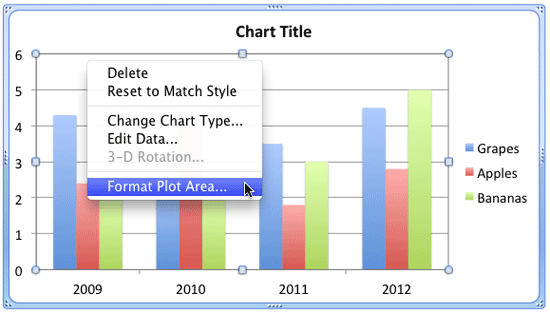
Figure 1: Format Plot Area option - Doing so summons the Format Plot Area dialog box, as shown in Figure 2. Make sure that the Fill option is selected within the sidebar (highlighted in red within Figure 2). Then select the Picture or Texture tab (highlighted in blue within Figure 2). Within this tab, click the Choose Picture button, highlighted in green within Figure 2.
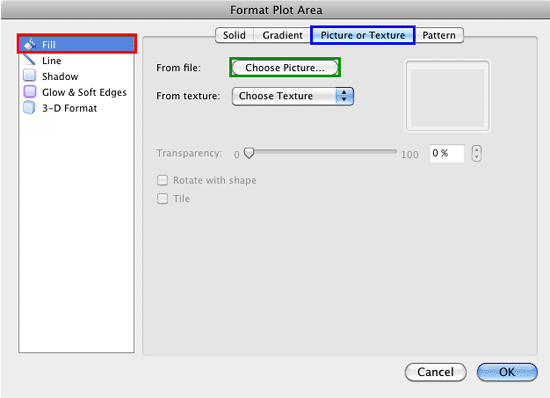
Figure 2: Picture or Texture tab within the Format Plot Area dialog box - Doing so will bring up the Choose a Picture dialog box as shown in Figure 3. In this dialog box, navigate to the folder where the picture to be used as fill is located, select it, and click the Insert button.
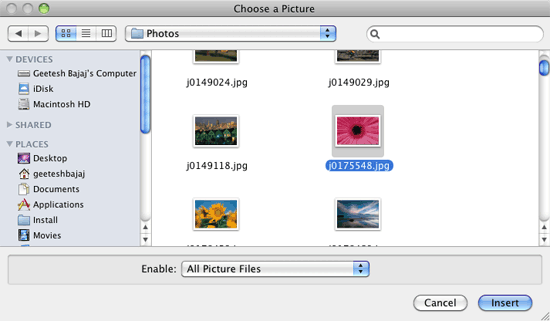
Figure 3: Choose a Picture dialog box - This step will take you back to the Format Plot Area dialog box, where you can now see the selected picture in the preview area, shown highlighted in red within Figure 4.
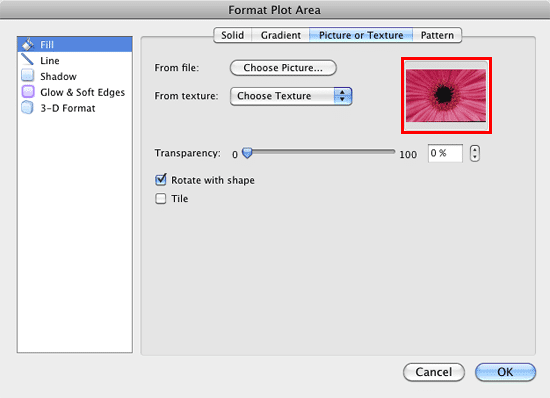
Figure 4: Picture fill chosen for the Plot Area Fill - At this point, you can make some more changes to the picture fill using the other options in the Format Plot Area dialog box as explained below:
- If you want to change the transparency of the picture fill, you can use the Transparency slider that you can see in Figure 4.
- If you want the picture used as a fill to be tiled, select the Tile check-box which you can see in Figure 4. By using this option you can make any picture to behave like a texture. To learn more about how to fill the Plot Area with a texture fill, refer to our Apply Texture Fills to Plot Area of Charts in PowerPoint 2011 for Mac tutorial.
Why Cannot I Rotate the Plot Area?
- Even though the Rotate with shape check-box is available for selection within the Format Plot Area dialog box, selecting/deselecting this option won't make any difference to the picture fill. This is because you can't rotate the Plot Area.
- Once you have made all required selections in the Format Plot Area dialog box, click the OK button to get back to the slide where you can see the selected Plot Area filled with the selected picture, as shown in Figure 5. We know this looks a little over the top, and we will mellow this down!
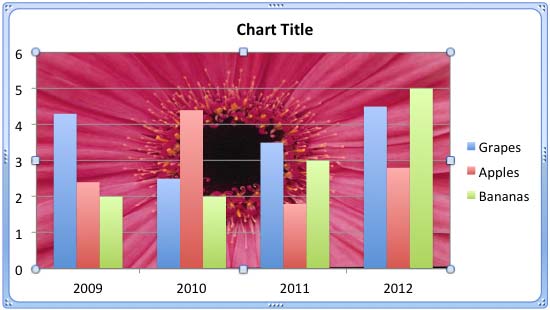
Figure 5: Plot Area applied with a picture fill - At this stage, if you feel that the picture is looking too prominent, you can adjust it's transparency to make it look muted. In Figure 6, you can see that we have set the transparency of the selected picture fill to 80% (highlighted in red).
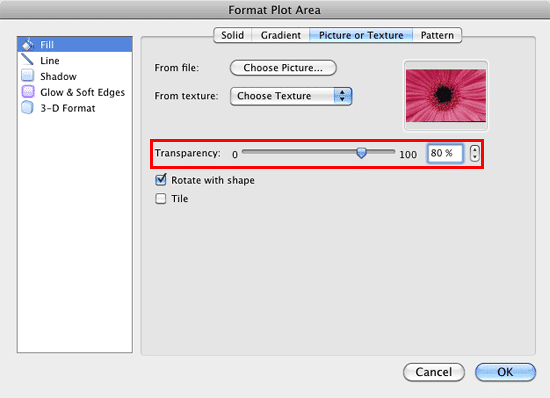
Figure 6: Picture fill's transparency set to 80% - Figure 7, shows our sample chart's Plot Area after we changed the transparency of the picture fill to 80% (compare with Figure 5).
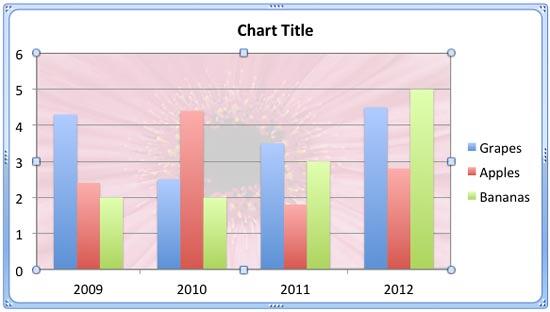
Figure 7: Plot Area applied with a picture fill that has 80% transparency - Save your presentation often.

