by Geetesh Bajaj, April 15th 2014
View this as a web page
To ensure future delivery of emails, please add mailinglist @ indezine.com
to your address book.
|
Hot and Cold Diagrams
 We already showed how you can create distance cartograms using concentric donut shapes within
PowerPoint. But that was only the beginning because it turns out that you can create so much more with the same shapes! Look at
this example of a hot and cold diagram that we found in the April 2014 issue of Inc. Magazine -- notice that this tells you which
celebrity is more tech savvy than others. Understandably, Ashton Kutcher is more tech savvy -- so he is right in the center of
this cartogram structure in the hottest zone. Around him as you travel to the edges of the cartogram, the tech savvy quotient
gets colder -- and you find many more celebrities here.
Read more here
|
|
|
Removing Customizations from PCB Files in PowerPoint
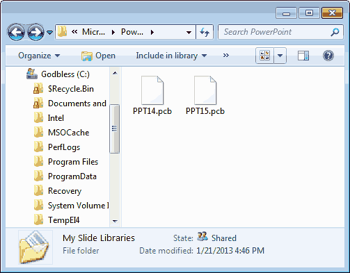
Have you wondered where PowerPoint stores all the customizations you make? Or all the
customizations that third party add-ins do? All these are saved within a PCB (PowerPoint Settings) file. Whenever PowerPoint
launches, it peeps inside the PCB file and sets up the customizations to make you happy!
Learn how to reset customizations from PowerPoint's PCB files
|
FlightDeck: Conversation with Noah Menikoff
 Noah Menikoff
 is chief architect and a managing partner at Synthesis Technology. He has over twenty years of
experience as a software engineer and business consultant with a focus on business process improvement. Synthesis Technology
offers Intelligent Communication Solutions for Financial Services firms and other regulated organizations. The Synthesis
FlightDeck solution makes it easy for organizations to create, manage and utilize large amounts of PowerPoint content. In this
conversation, Noah discusses FlightDeck.
Read the conversation here
|
Learn PowerPoint 2013 for Windows
Types of Points (Vertexes)
Every shape in PowerPoint is a combination of segments and points. The points are essentially what is also known as vertexes
-- and segments are straight or curved lines between these vertexes. These segments and points are similar to a "connect-the-dots"
drawing and the dots would be points, and the lines you draw between the dots would be segments. Both the segments and vertexes
are only individually visible within Edit Points mode. We discuss more about segments in a subsequent tutorial but for now, let
us help you explore the different types of vertexes (points) in PowerPoint 2013. Essentially, these are of three types.
Display Theme Name in Status Bar
Both PowerPoint 2010 and PowerPoint 2007 show the name of the active Theme for a presentation within the Status Bar. Now, look
for a similar option within the PowerPoint 2013 interface. Note that there is no Theme name displayed on the Status Bar. However
you can reinstate the Theme name, as explained in this tutorial.
Edit Points - Open and Close Paths
The Shapes gallery in PowerPoint consists of various shapes, both open and closed. Most of the shapes in this gallery
are closed shapes (rectangle, ellipse, and triangle are some of the closed shapes). There are also a few open shapes
such as the straight point to point line. Some other tools let you create both open and closed shapes -- these are
the Freeform Line, Curve, and Scribble tools. In addition, you can convert any closed shape into an open shape and
vice versa, as you will learn in this tutorial.
Curved and Straight Line Segments
A line (outline) in PowerPoint contains both points and segments -- think about connect-the-dots as an analogy and the dots
will represent points. The segments on the other hand will represent the lines you draw between the dots. Among points and
segments, we have already explored the types of points in PowerPoint 2013. We now explore the two types of Segments in
PowerPoint 2013: Straight and Curved. Segments can be edited and you can also convert a straight segment to a curved segment
and vice versa, as you will learn in this tutorial.
|
Learn PowerPoint 2011 for Mac
Apply Gradient Fills to Plot Area of Charts
There are various fills that you can apply to the Plot Area of a chart, such as a solid color, a picture, a texture, or a pattern,
or a gradient fill. Gradient fills are typically blended fills between two or more colors that graduate from one color to another
-- and if you use neutral or muted colors, then a gradient fill can provide a great, understated backdrop for your chart. In this
tutorial, let us learn how to apply a gradient fill to the Plot Area of a chart.
Apply Picture Fills to Plot Area of Charts
Picture fills can look great and distracting at the same time -- it all depends upon the type of picture you use for the fill -- and
also what you fill with a picture. If you end up using a picture as a fill for your chart's Plot Area, then you must put in plenty of
thought before you decide to do so. Why? Because you don't want to crowd your chart -- and so while you can use a picture, it's best
to use one that's muted and does not attract too much attention.
|
Learn PowerPoint 2010 for Windows
Change the Default Template or Theme
When launched, you will notice that PowerPoint opens with an empty presentation of just one slide. Typically,
you will find placeholders for the slide's title and subtitle here. Any text you type within these placeholders
shows up in black over a white slide background. This is the default look that PowerPoint provides -- but you don't
have to use this default look all the time. You can change this look to something else -- for example, do you want
to use your custom PowerPoint template or Theme as the default? Or even any of the other templates / Themes built
within PowerPoint.
|
Learn PowerPoint 2003 for Windows
Removing Customizations from PCB Files
PowerPoint add-ins help in adding new capabilities that can polish your presentation in many ways. But when the time comes to
uninstall these add-ins for whatsoever reason, you might be surprised to find their menu customizations still existent! Click
those menu extensions and nothing may happen -- but these menu options are still there! In another scenario, you may have
customized your PowerPoint menus and toolbars to a large extent -- and may now want to restore everything to a pristine
state -- almost like how the interface looked when you first installed PowerPoint.
|
|
New PowerPoint Templates on Indezine
|
|
New PowerPoint Templates on MedicinePPT
|
|
New PowerPoint Templates on LegalPPT
|
|
New PowerPoint Templates on FreePPTTemplates
|
|
New PowerPoint Templates on ChristianPPT
|
|
|
|
|
|
|
|
|
End Note
Received this email from a friend? If you would like to join our mailing list,
go here.
Read past issues of this newsletter
This newsletter provides more info on better PowerPoint usage, and presentation design. You can also opt to get
our RSS feed, where you can get updates
through Feedburner.
See our Privacy Policy.
Follow on Twitter |
Join our LinkedIn Group
| Join our Facebook Group
Do let us know how we are doing -- we love to hear from
you! And if you enjoyed reading any content on Indezine.com, please do like them on Facebook and other
social platforms, click the Google +1 buttons on all these pages, and tweet them all so that you can share
these joys with others -- and keep your feedback coming! Have a fabulous week.
You can also find new templates everyday on the PowerPoint blog along with information on what's new and happening
in the world of PowerPoint -- check out at http://blog.indezine.com/.
The Indezine News mailing list is powered by
Aweber.
|
|