After designing your learning material and quizzes for an online course within Adobe Presenter, you would want to
know how this online course will help the learners grasp the content better. Although, the LMS (Learning Management
System) provides details about course completion and quiz results, it does not show the learners' progress. To overcome
this issue, Adobe Presenter offers a Learning
Analytics dashboard that empowers instructors with the ability to detect potential learning problems and to
intervene early-improving the chances for learners to meet and even exceed their expectations.
The Learning Dashboard also allows you to check the details about which course screens were most or least visited
and on which screens the learners spent the most or least time. It also gives a detailed report of the questions
answered correctly by all or by none of the learners. With this data, you will be able to identify the extremely easy
and extremely difficult questions that could be eliminated from the quiz.
To explore Adobe Presenter's Learning Dashboard, follow these steps:
- Within PowerPoint, access the Adobe Presenter tab of the
Ribbon, and click the
down-arrow within the Collaboration button (highlighted in red
within Figure 1). Within the drop-down menu that appears select the
Learning Dashboard option, as shown highlighted in blue within
Figure 1.
-

Figure 1: Learning Dashboard option
Note: If you don't have the
Adobe Presenter tab within the
Ribbon in PowerPoint, that may indicate you haven't installed it. This tab is not built-in within
PowerPoint and is installed as part of a
PowerPoint
add-in from Adobe called Presenter.
- This opens the Learning Dashboard web page within a browser, as shown in Figure 2. Here
click the Login button, as shown highlighted in red within
Figure 2.
-

Figure 2: Learning Dashboard web page
- This brings up the Login dialog box, as shown in Figure 3. Here you have
to sign in -- enter your Adobe ID and click the Sign In button, as shown highlighted in
red within Figure 3.
-
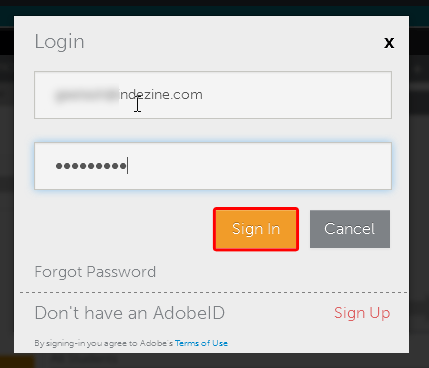
Figure 3: Login dialog box
- Once logged in, you can see the Learner Analytics Dashboard web page, as shown
in Figure 4.
-
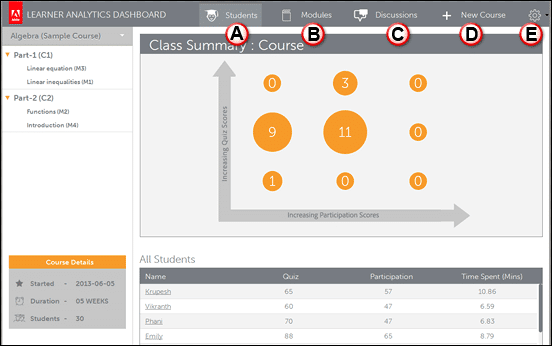
Figure 4: Learner Analytics Dashboard web page
- Tabs within the Learner Analytics Dashboard web page are explained below, as marked
in Figure 4, above.
A. Students
- Within the Students tab you can view the progress of all the students, as shown in
Figure 5. The performance is evaluated based on the Collaboration criteria and the success criteria
that you defined in the New Course screen.
-
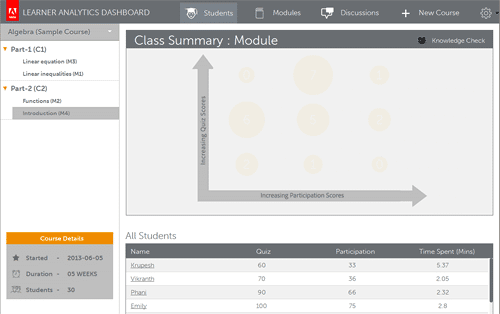
Figure 5: Students tab
B. Modules
- Within the Modules tab, you can graphically view the module-wise progress
by the students, as shown in Figure 6. You can change the current module information.
-
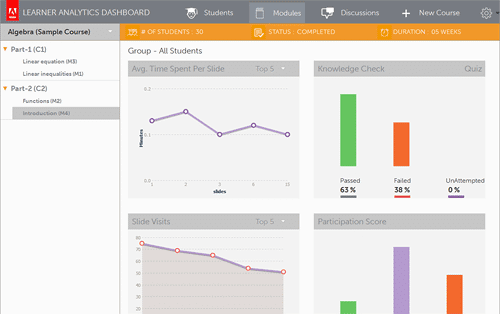
Figure 6: Modules tab
- Within the Modules tab, the information displayed is based on:
- Time spent per slide by the students. You can view either the Top 5 slides on which the students spent maximum time
or the Bottom 5 by selecting the drop-down value.
- The Top 5 or the Bottom 5 slides that attracted the maximum students. Select the appropriate value from the
drop-down list.
- Time spent in each segment of the video. 30 seconds of a video is defined as one segment.
- Total number of visits to each segment of the video.
- Knowledge level check for all students based on passed, failed, or not attempted parameters.
- Participation Score segregated based on the high, medium, and low participation percentage.
C. Discussions
- This tab shows the list of discussions -- if there are any. In
Figure 7 you can see that there is no discussion for the selected course.
-

Figure 7: Discussions tab
D. New Course
- Within this tab you can create a new course, as shown in
Figure 8. Just enter the details, define the success criteria by entering the appropriate values. Once
done click the Next button, as shown highlighted in red within
Figure 8.
-
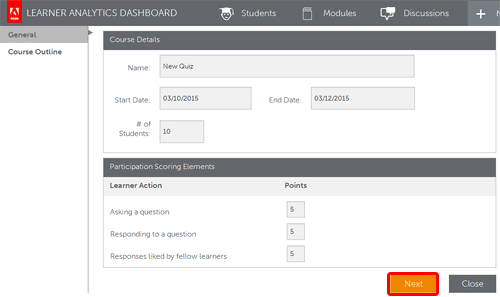
Figure 8: New Course tab
- This brings up the Course Outline sub-tab within the
New Course tab. Here you can see the list of modules, you can select to include the Metadata XML
file, etc., as shown in Figure 9. Once done, click the Create button, as shown
highlighted in red within Figure 9.
-

Figure 9: Course Outline sub-tab
E. Settings
- Click the setting icon to bring up the drop-down list, as shown in Figure 10. Here
you can view and manage your personal settings. Click the Course Settings option, as shown
highlighted in red within Figure 10.
-
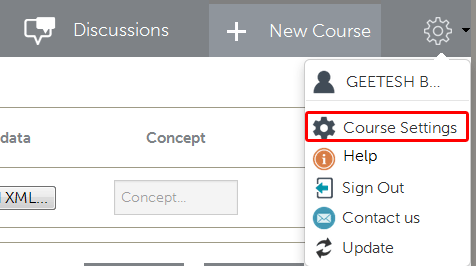
Figure 10: Settings drop-down list
- This brings up a page where you can view the details of your course and add, modify, or delete
the courses.
-

Figure 11: Course Settings page
- Use the Learning Dashboard to keep a track of you online courses.


